18 March 2018 (updated: 16 July 2020)
Speed Up Your App Performance with Android Profiler
Chapters

Have you ever noticed a sudden freeze of an app you developed? Anyway, imagine it just happened. Is your next step to profile the app process with Android Profiler? If not, I wrote this article especially for you!
Android Profiler is a set of tools available from Android Studio 3.0 that replace previous Android Monitor tools. The new suite is far more advanced in diagnosing app performance issues. It comes with a shared timeline view and detailed CPU, Memory and Network profilers. By using it skilfully, we can save a lot of time wasted on debugging or scrolling logs in a Logcat window.
To access profiling tools click View > Tool Windows > Android Profiler or find a corresponding tool window in the toolbar. To see realtime data you need to connect a device with enabled USB debugging or use Android emulator and have the app process selected. I encourage you to read the official Android user guide to learn how to inspect all the data displayed in this window.
Do you like learning by examples? I prepared two samples to practice with the CPU Profiler. These are small apps that encountered some performance problems. Let’s try to solve them!
Android App Performance Optimization
Sample 1
We will start from developing a simple Android application that displays a list of sequential dates (which hasn’t happened yet). Below each date we can display remaining time in days, hours, minutes and seconds.
The code from both samples is available on GitHub, so you can easily clone the repository and open the project in Android Studio. For now, checkout the revision tagged sample-1-before.
Start with defining a layout consisting of RecyclerView placed inside SwipeRefreshLayout. It will allow the data to refresh on the vertical swipe gest
Next, create Activity that inflates our layout, handles user interaction and performs operations on the main thread to display refreshed data:
In line 9 we use RecyclerView adapter. We are using recycler library from android-commons (used in most EL Passion Android projects). A generic function takes a list of items, item layout resource reference and a binder. The aim is to keep the code concise and setup RecyclerView adapter without any boilerplate code.
At the end of onCreate function we set the listener to be notified about refresh actions triggered by SwipeRefreshLayout. The referenced refreshData function replaces the list with fresh new items and notifies the adapter about any data change.
In line 25 we generate a list of 1000 items. Each item sets its properties in relation to the current date time and the offset in days. Offset takes values from 0 to 999 and affects the date displayed by item (see line 29). We use ThreeTenABP as our dates and duration API. It is an invaluable backport of java.time.* package optimized by Jake Wharton for Android.
In line 36 we perform some operations to receive remaining time as a more human-readable duration.
In line 50 we bind an item with the view holder to update itemView at a specified position. We access resources to get the string formatted with remainingTime value.
Item itself holds formattedDate and remainingTime values ready to display in the corresponding TextView components. Let’s use the following item layout:
Launch the app and swipe to refresh data. Have you noticed a freeze? Possibly not. That strongly depends on your device’s CPU and other processes consuming CPU time. Now, launch Android Profiler Tool Window and select the proper timeline to open CPU Profiler. Connect your device and swipe to refresh again. Note that profiler threads are added to the app process and consume additional CPU time. I assume that now you have already experienced frames skipping. Look at the Logcat since the choreographer should have warned you already about heavy processing:
I/Choreographer: Skipped 147 frames! The application may be doing too much work on its main thread.Cool! We can start our inspection. Look at the CPU Profiler timeline:
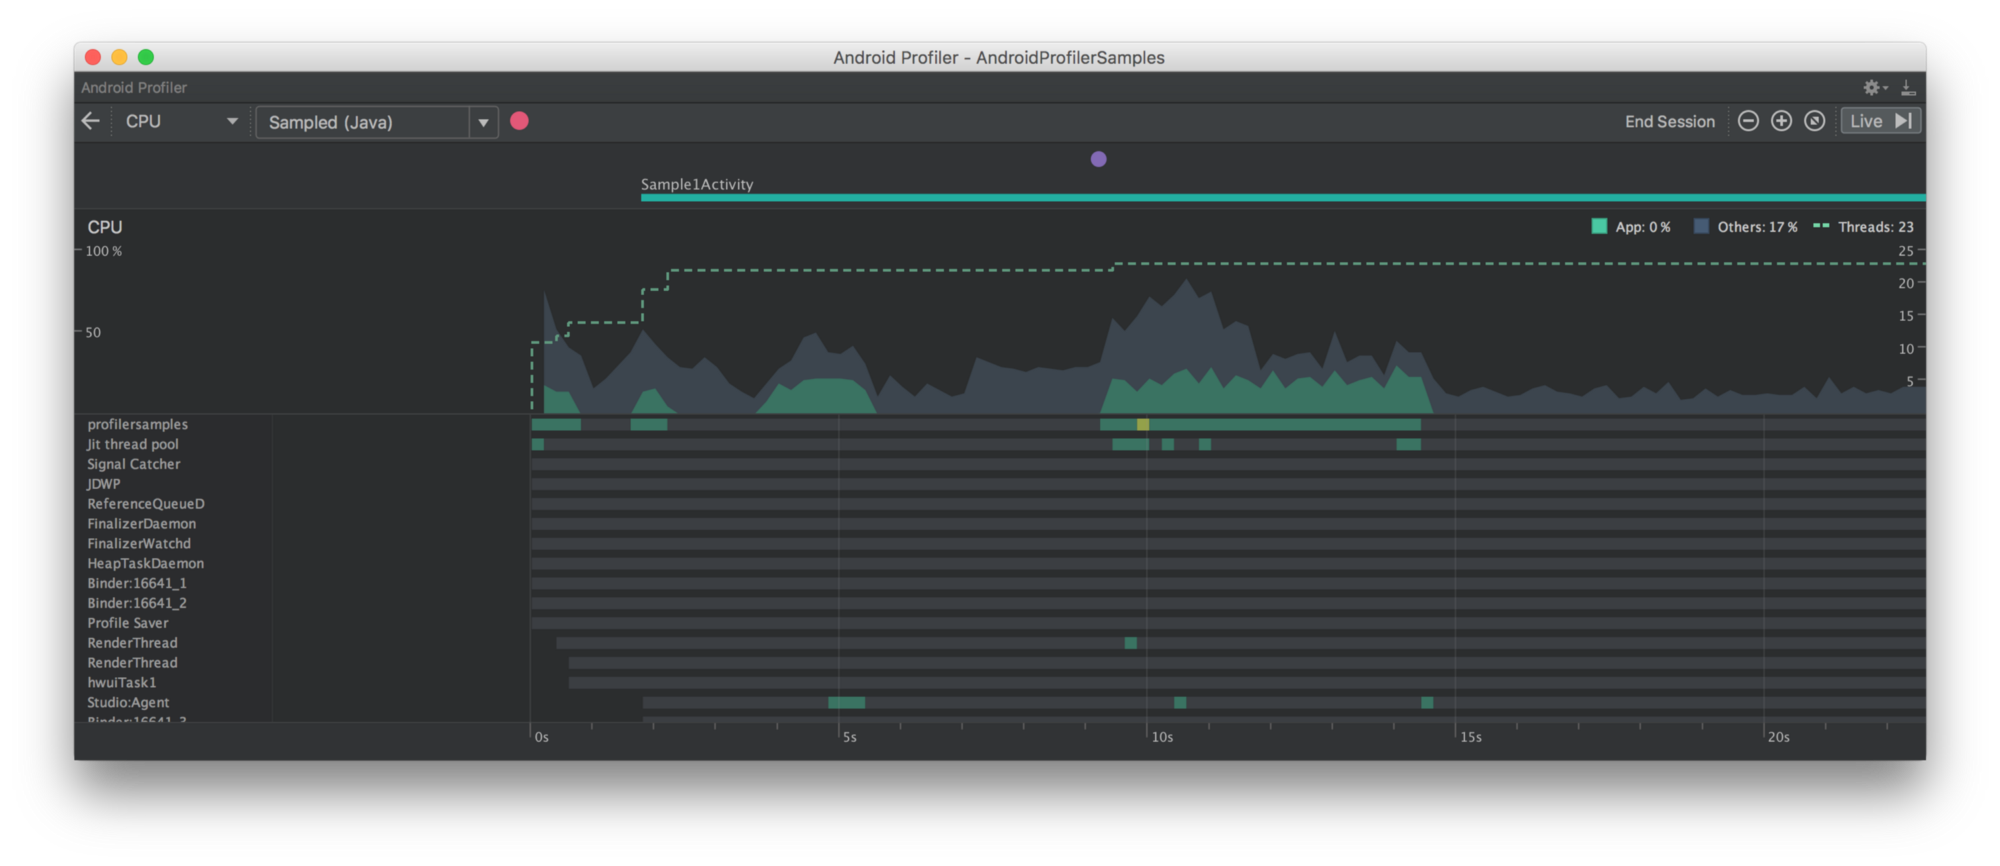
Above the chart there is a view representing user interaction with the app. All the user input events show up here as purple circles. You can see one circle that represents the swipe we performed to refresh data. A little lower you can find currently displayed Sample1Activity. This area is called Event timeline.
Below events, there is a the CPU timeline, that graphically shows the CPU usage of the app and other processes in relation to the total CPU time available. What’s more, you can watch the number of threads your app is using.
At the bottom you can see the Thread activity timeline belonging to the app process. Each thread is in one of three states indicated by colours: active (green), waiting (yellow) or sleeping (grey). At the top of the list you can find the app’s main thread. On my device (Nexus 5X) it uses ~35% of CPU time for about 5 seconds. That’s a lot! We can record a method trace to see what is happening in there.
Click the the Record button 🔴 right before swiping to refresh action and stop recording ⏹ soon after data refresh completes. When you are done, note that the method trace pane has just appeared:
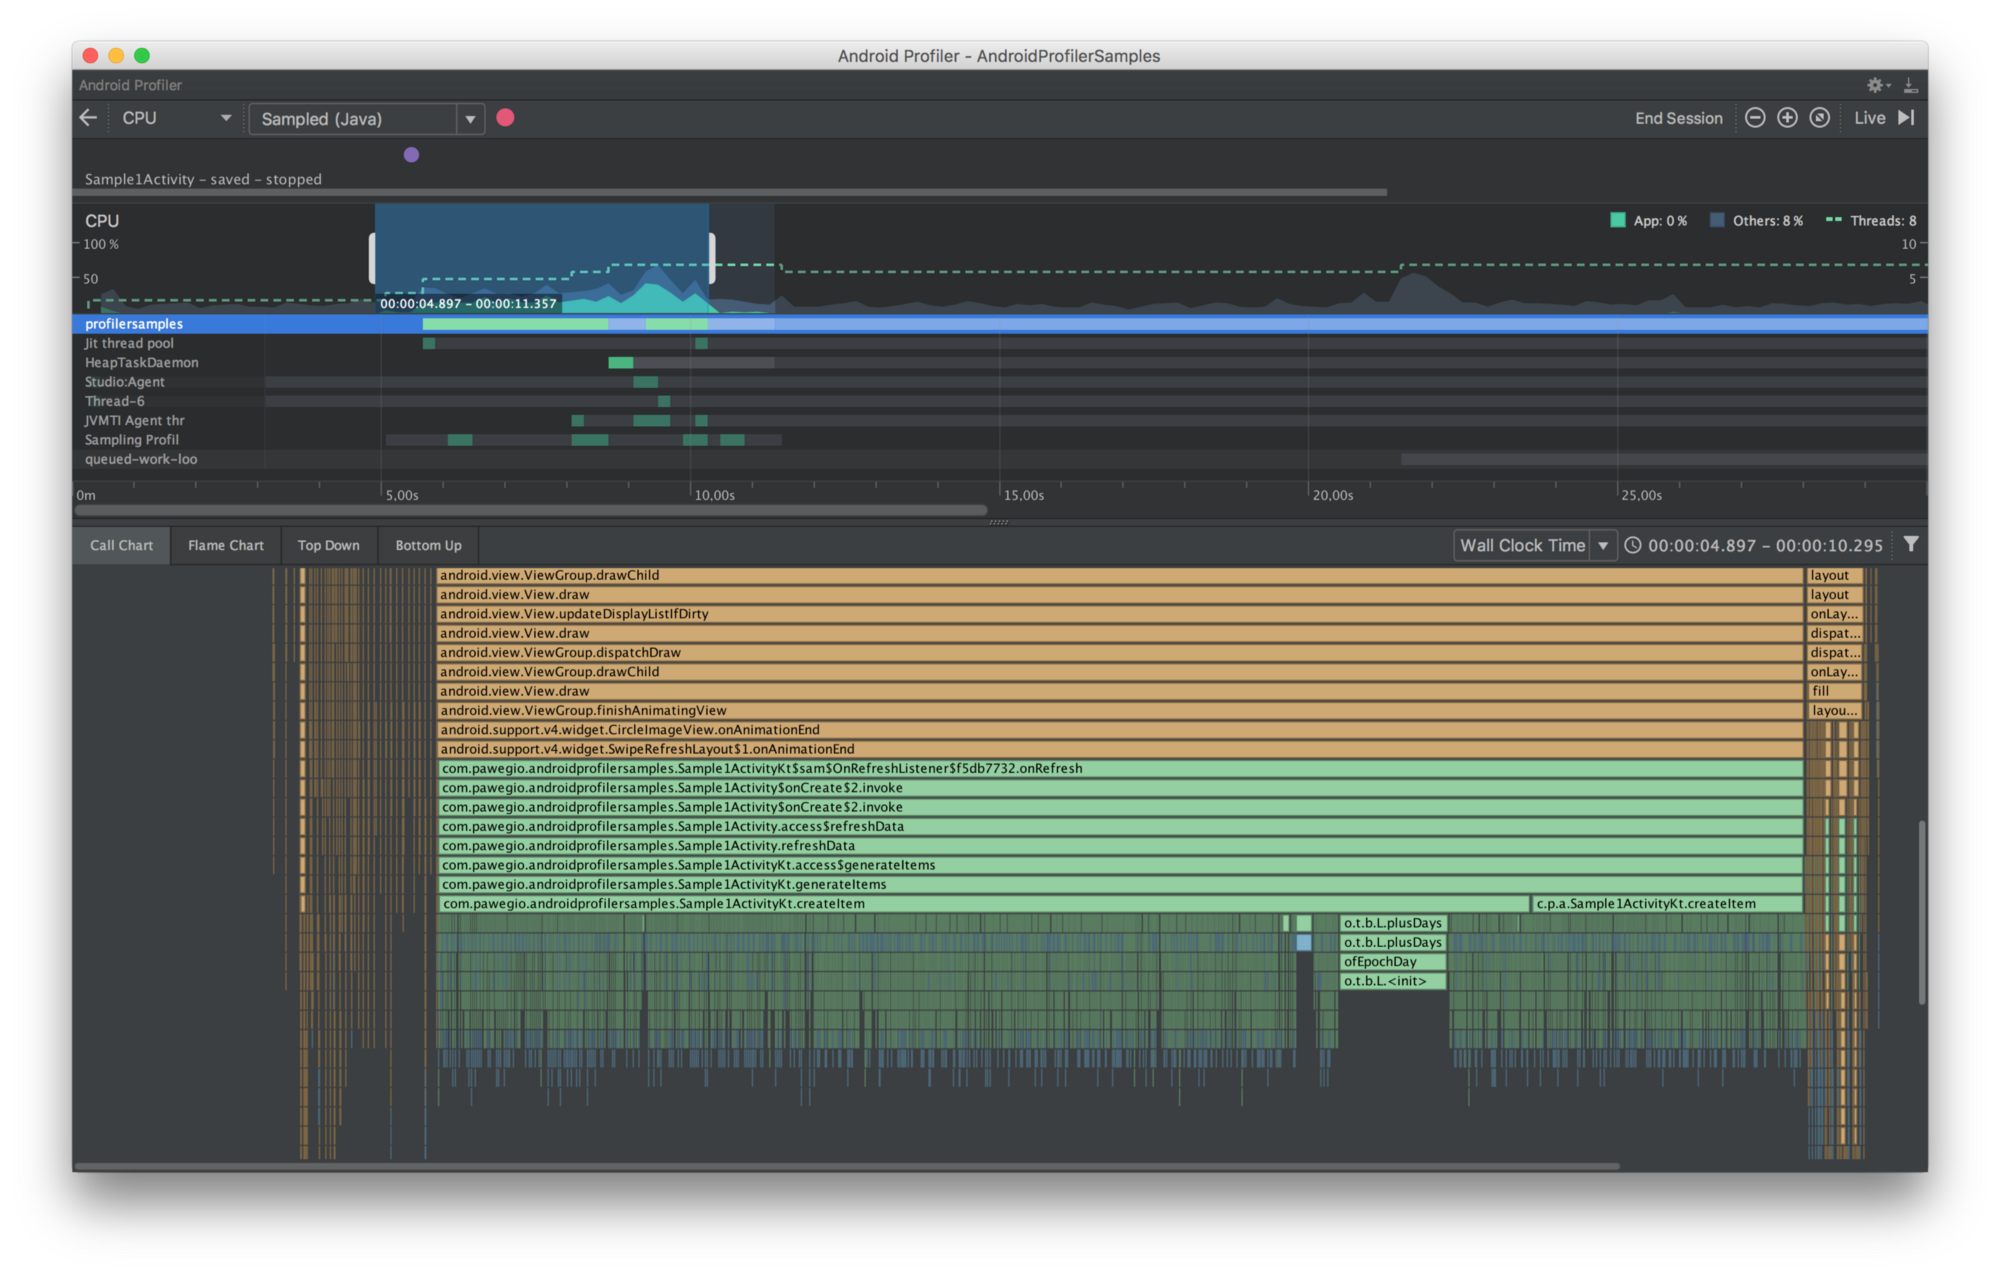
We will start our analysis from the Call Chart displayed in the first tab. The horizontal axis represents the passage of time. Callers and their callees (from top to bottom) are displayed on the vertical axis. Method calls are also distinguished by colour depending if it is call to system API, third-party API or our method. Note that total time for each method call is a sum of method self-time and its callees time. From this chart, you can deduce that the performance issue is somewhere inside generateItems method. Move a mouse over the bar to check more details about elapsed time. You can also double-click bar to see method declaration in the code. It is quite hard to deduce more from this tab because it requires a lot of zooming and scrolling, so we will switch to the next tab.

The Flame Chart is much better to reveal which methods took our device precious CPU time. It aggregates same call stacks, inverting chart from the previous tab. Instead of many short horizontal bars, single longer bar is displayed. Just look at it now:
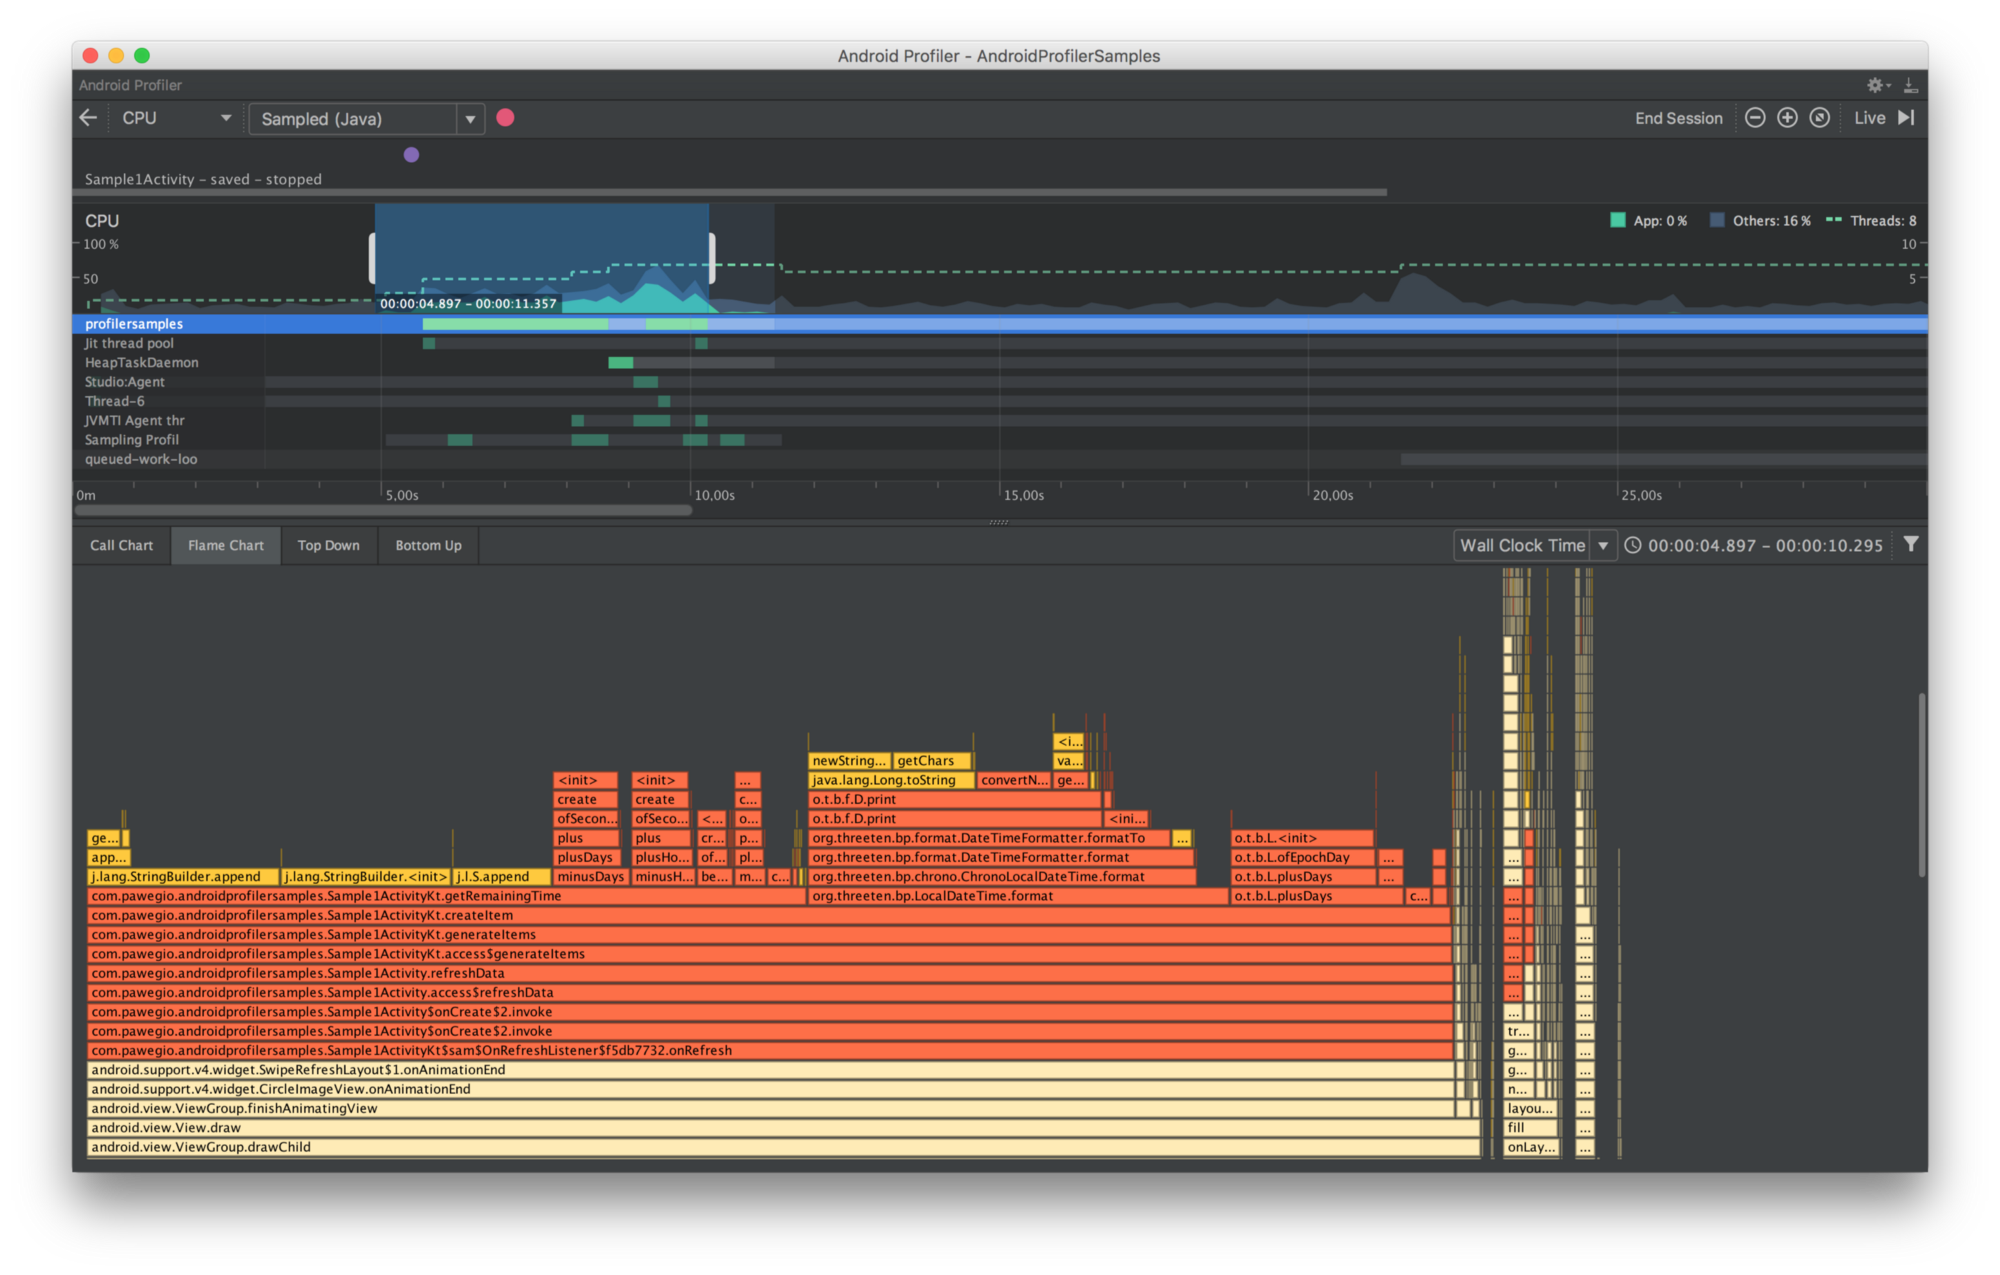
Two suspicious methods found. Would you believe that getRemainingTime the total method execution time will take over 2 seconds and LocalDateTime.format over 1 second of CPU time?

Note that this time includes also any period of time when thread was not active. In the upper right corner of the method trace pane, you can switch timing information to be displayed in the Thread Time. If we analyse a single thread that might be preferred option since it shows CPU time consumption not affected by other threads.
Ok, let’s move on. Now open the last tab to see the Bottom Up chart. It displays a list of method calls sorted descending by CPU time consumption. This chart will give us detailed timing information (in microseconds). Expanding the methods you can find their callers.
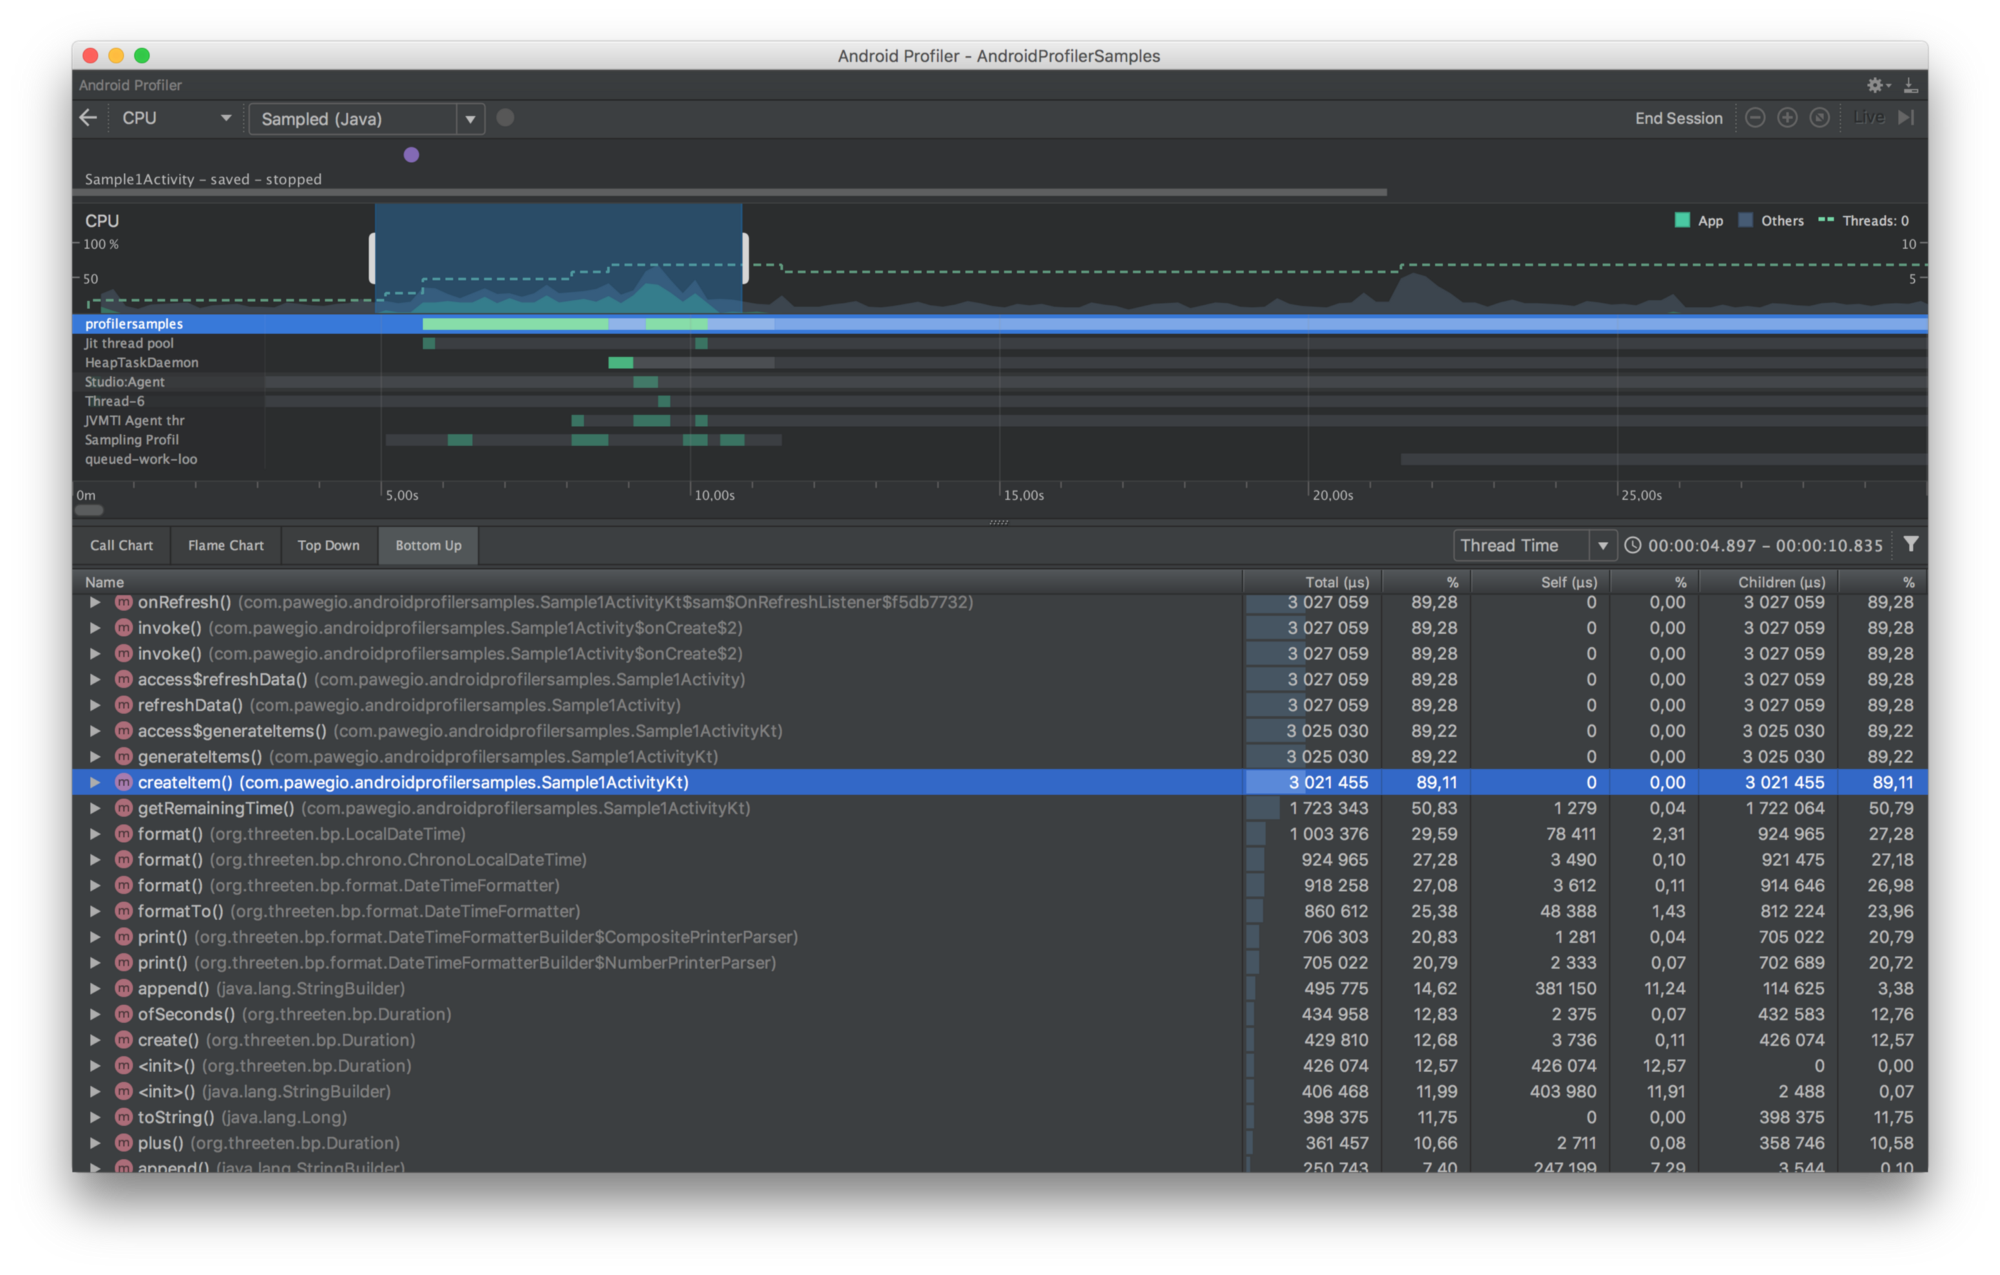
Get out of the chart timing information about methods we accused of consuming too much CPU time. Place them in relation to two methods from their call stack:
You can see that getRemainingTime and LocalDateTime.format consume over 80% of recorded method trace! To fix that freeze, we need to work on generating items. That’s obvious.
So, what to do? You’ve probably come up with several solutions already. We perform a heavy computation to create 1000 items (not a small number). You can think about implementing a pagination to gradually create and display the data. That’s a great idea since it will scale. However, this time I would like to head another way. What if we perform all the formatting recently before displaying the data in RecyclerView at specified position — when we bind Item with RecyclerView.ViewHolder? Thanks to that, we will invoke getRemainingTime and LocalDateTime.format methods just for few currently displayed and ready to display items — not thousand times as before. To achieve it we need to update Item properties to hold only necessary data to perform formatting later:
That requires applying following changes in generateItems and bindItem functions:
Let us see that we inlined the createItem function since all the formatting now occurs inside the bindItem method. Checkout the revision tagged sample-1-after to receive these changes.
It’s time to relaunch the CPU Profiler and record the method trace after changes in our code were introduced. Look at the Call Chart to check if our optimization went well:
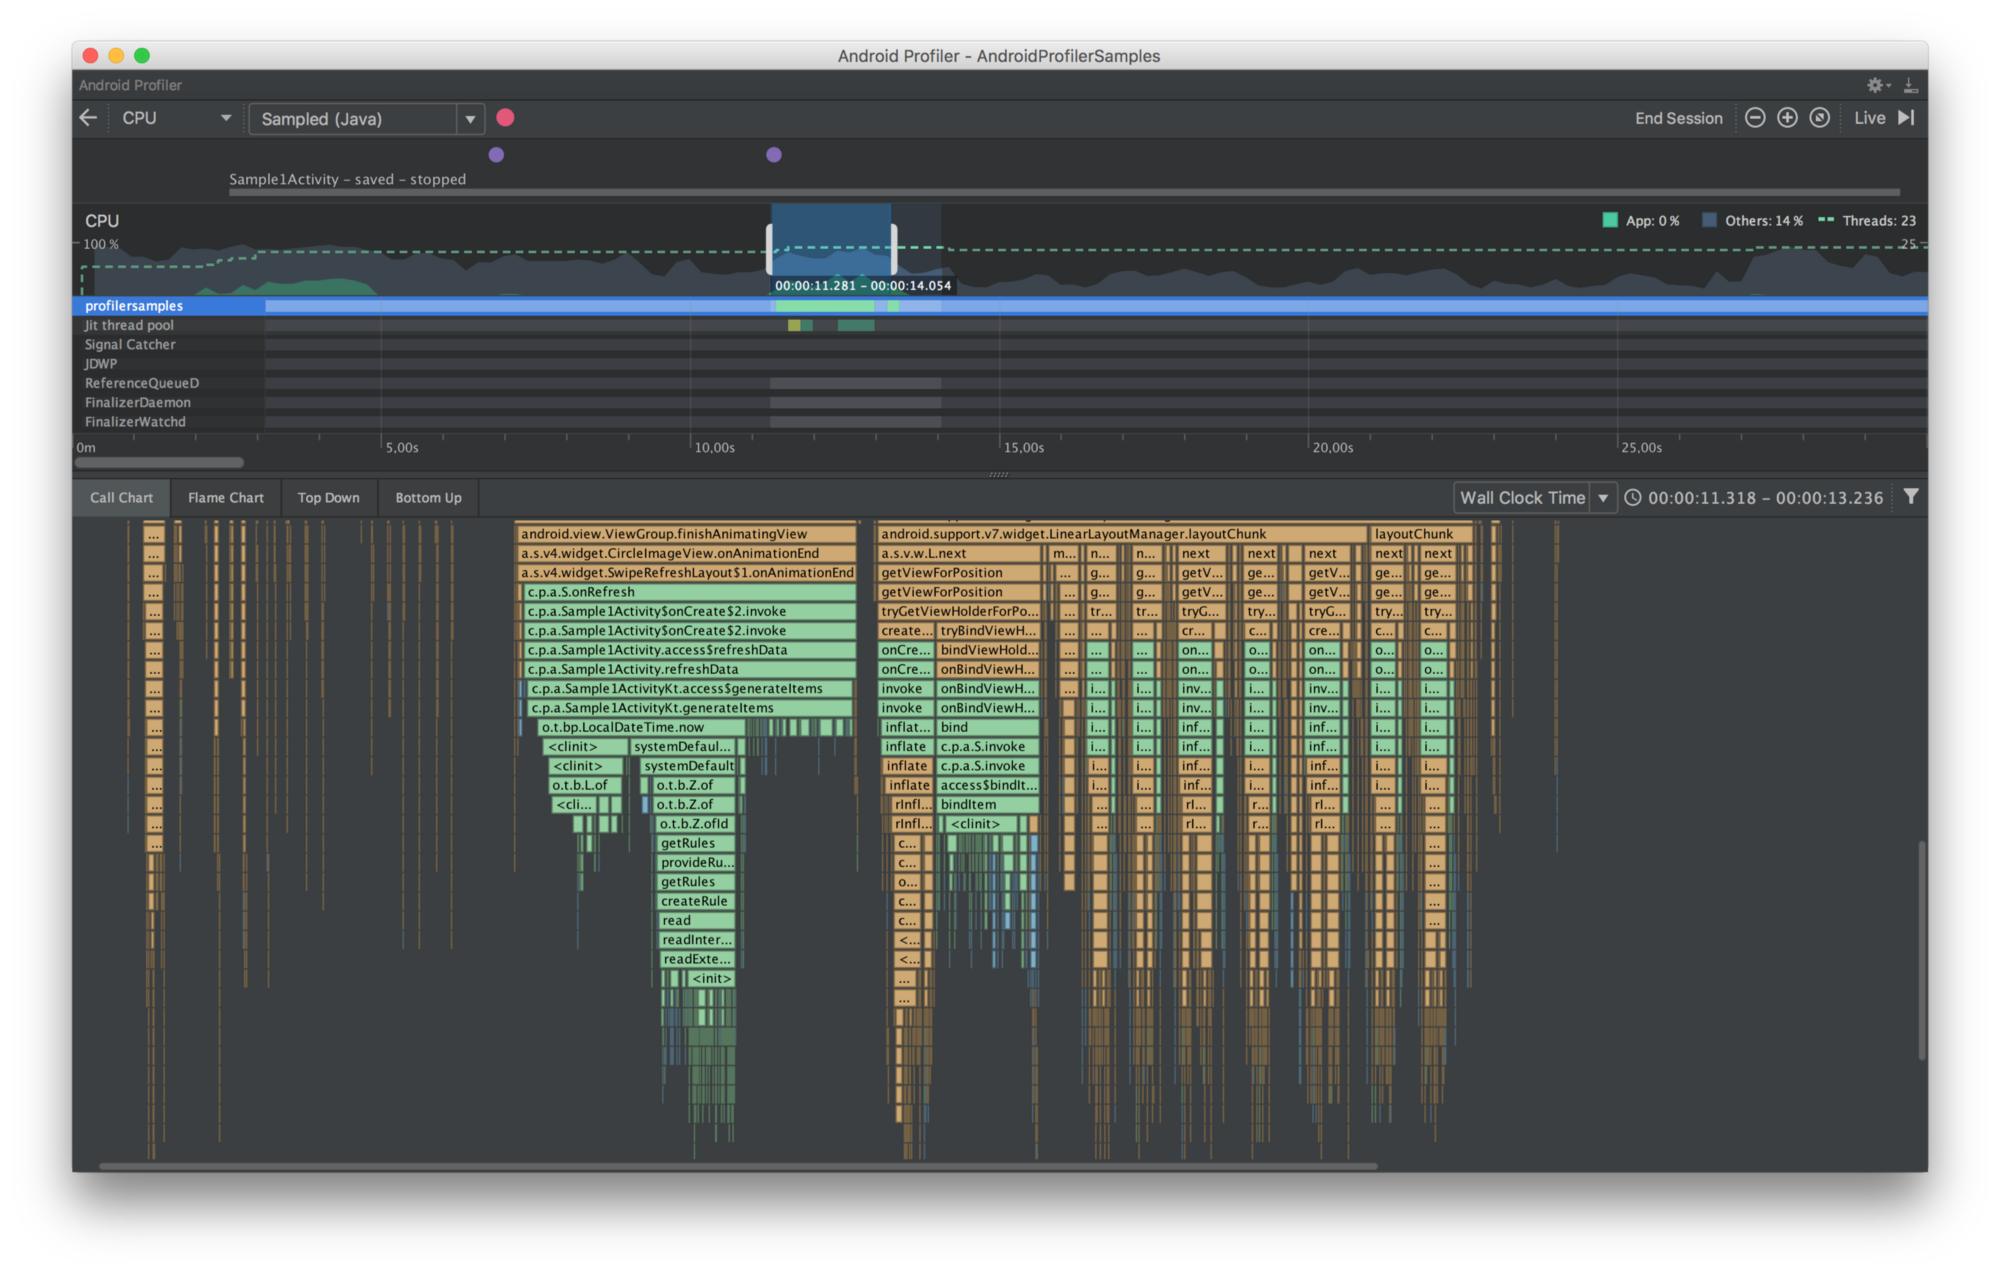
If you move the mouse over the generateItems function, you will find out that now it consumes ~0.3 seconds of the wall clock time. That’s over 13 times less CPU time than before optimization! Before we start celebrating, let’s switch to the Flame Chart to make sure our changes have no negative impact on total duration of the bindItem method. Fortunately, it consumes up to 0.1 seconds.
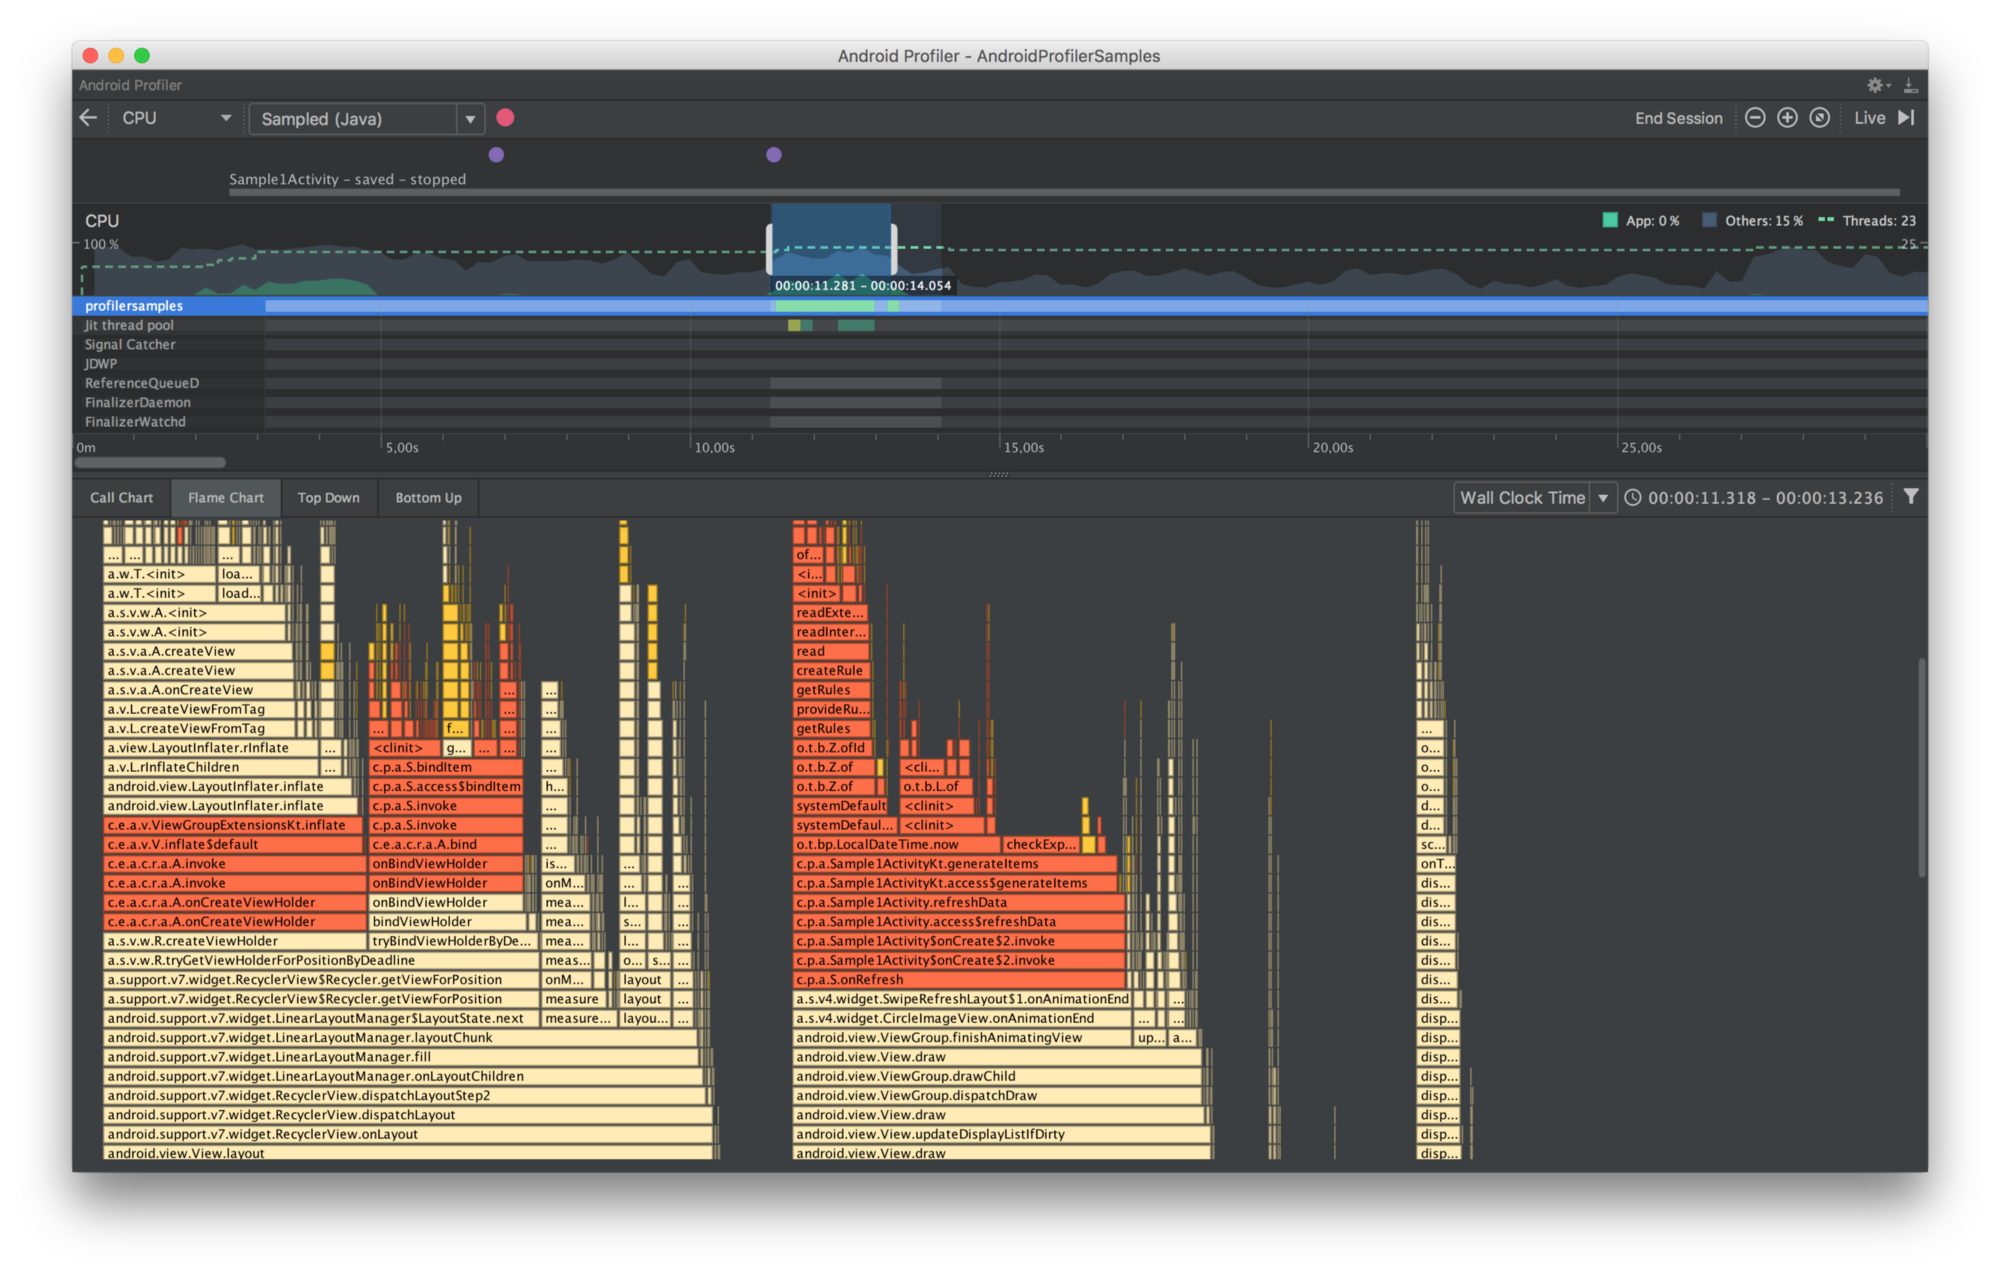 Additionally, you can scroll it to ensure our optimization doesn’t affect overall app performance. Try to record the method trace during such a scroll. See that choreographer no longer complains about skipping frames. Success! The code is optimized and we are done with the first sample!
Sample 2
In the next sample, we will mostly reuse the code from the sample 1 after optimization. The only change we will make in activity layout. We will add an ImageView above the RecyclerView. To make the whole content scrollable put both views inside NestedScrollView:
To avoid conflicts in scrolling behaviour of the RecyclerView we need to set the nestedScrollingEnabled attribute to false. Checkout the revision tagged sample-2-before to pull this sample quickly. Launch the app and swipe to refresh the data. You should note a freeze even without Android Profiler attached.
This time, I decided to let you perform diagnosis on your own not to spoil your fun. After successful app performance optimization, you shouldn’t encounter any freeze like in the sample 1. There’s only one rule —the screen displayed to the user can not change its appearance. Good luck!
Summing up
I do believe that I encouraged you to look at the Android Profiler more often. I think this is a good practise if we care about smooth user experience. In this article, I mainly focused on the CPU Profiler. However, both a Memory Profiler and a Network Profiler that are not covered in the text are also worth looking into. Recording memory allocation helps a lot in finding leaks, e.g. blaming you for not recycled Bitmaps. Anyhow, profiling the network activity might lead to multiple optimizations aiming at reducing battery drain.


