


Chapters
A step-by-step guide on how to create custom maps using Mapbox and Mapbox Studio.
About Mapbox
Mapbox is a platform that deals with creation of tools for designing and creating maps for web/mobile applications using mostly OpenSource software such as OpenStreetMap.
The Mapbox GL JS library, allows rendering dynamic maps in the web/mobile application, creating custom styles, 3D visualizations, and animations (You can see a gallery of sample styles here). Because Mapbox relies on client-side map rendering, it allows developers to dynamically change styles or display data directly in response to user interaction.
In this article, we will show you how to create a custom map style using Mapbox Studio tool and how to use it in the sample Next.js project.
What is Mapbox Studio?
When creating a new project, especially one whose central part is a map, we come to a point when we have to decide what the map should look like. If this is a project where we don't care about appearance and attracting users with an interesting design, we have the option to use standard styles which also look great. Each map provider offers a smaller or larger number of ready-made styles, and this is also the case with the US provider called Mapbox.
On the Mapbox website, in the gallery tab, we can check and test the available styles. We have both 2D and 3D versions available.
Like I said before, they look really great and in most cases they are sufficient! But what if we want to stand out from the competition, or we have a case where the client requires that the main color of the map should be blue and the names of the cities be pink? I know, it's an abstract idea, but we can't exclude it.
Mapbox developers have addressed these issues and created a special tool that allows you to create your own, perfectly fitting and standout map styles from scratch, called Mapbox Studio.
How to create map styles from scratch using Mapbox Studio?
To do this, you should first create an account on the Mapbox website. After logging in, you will have access to your account panel.
Mapbox's billing plan is pay-as-you-go, and because Mapbox provides us with 50k free map-loads per month, we don't have to worry about costs or attaching a credit card to the account. Creating new styles in Mapbox Studio is also free.
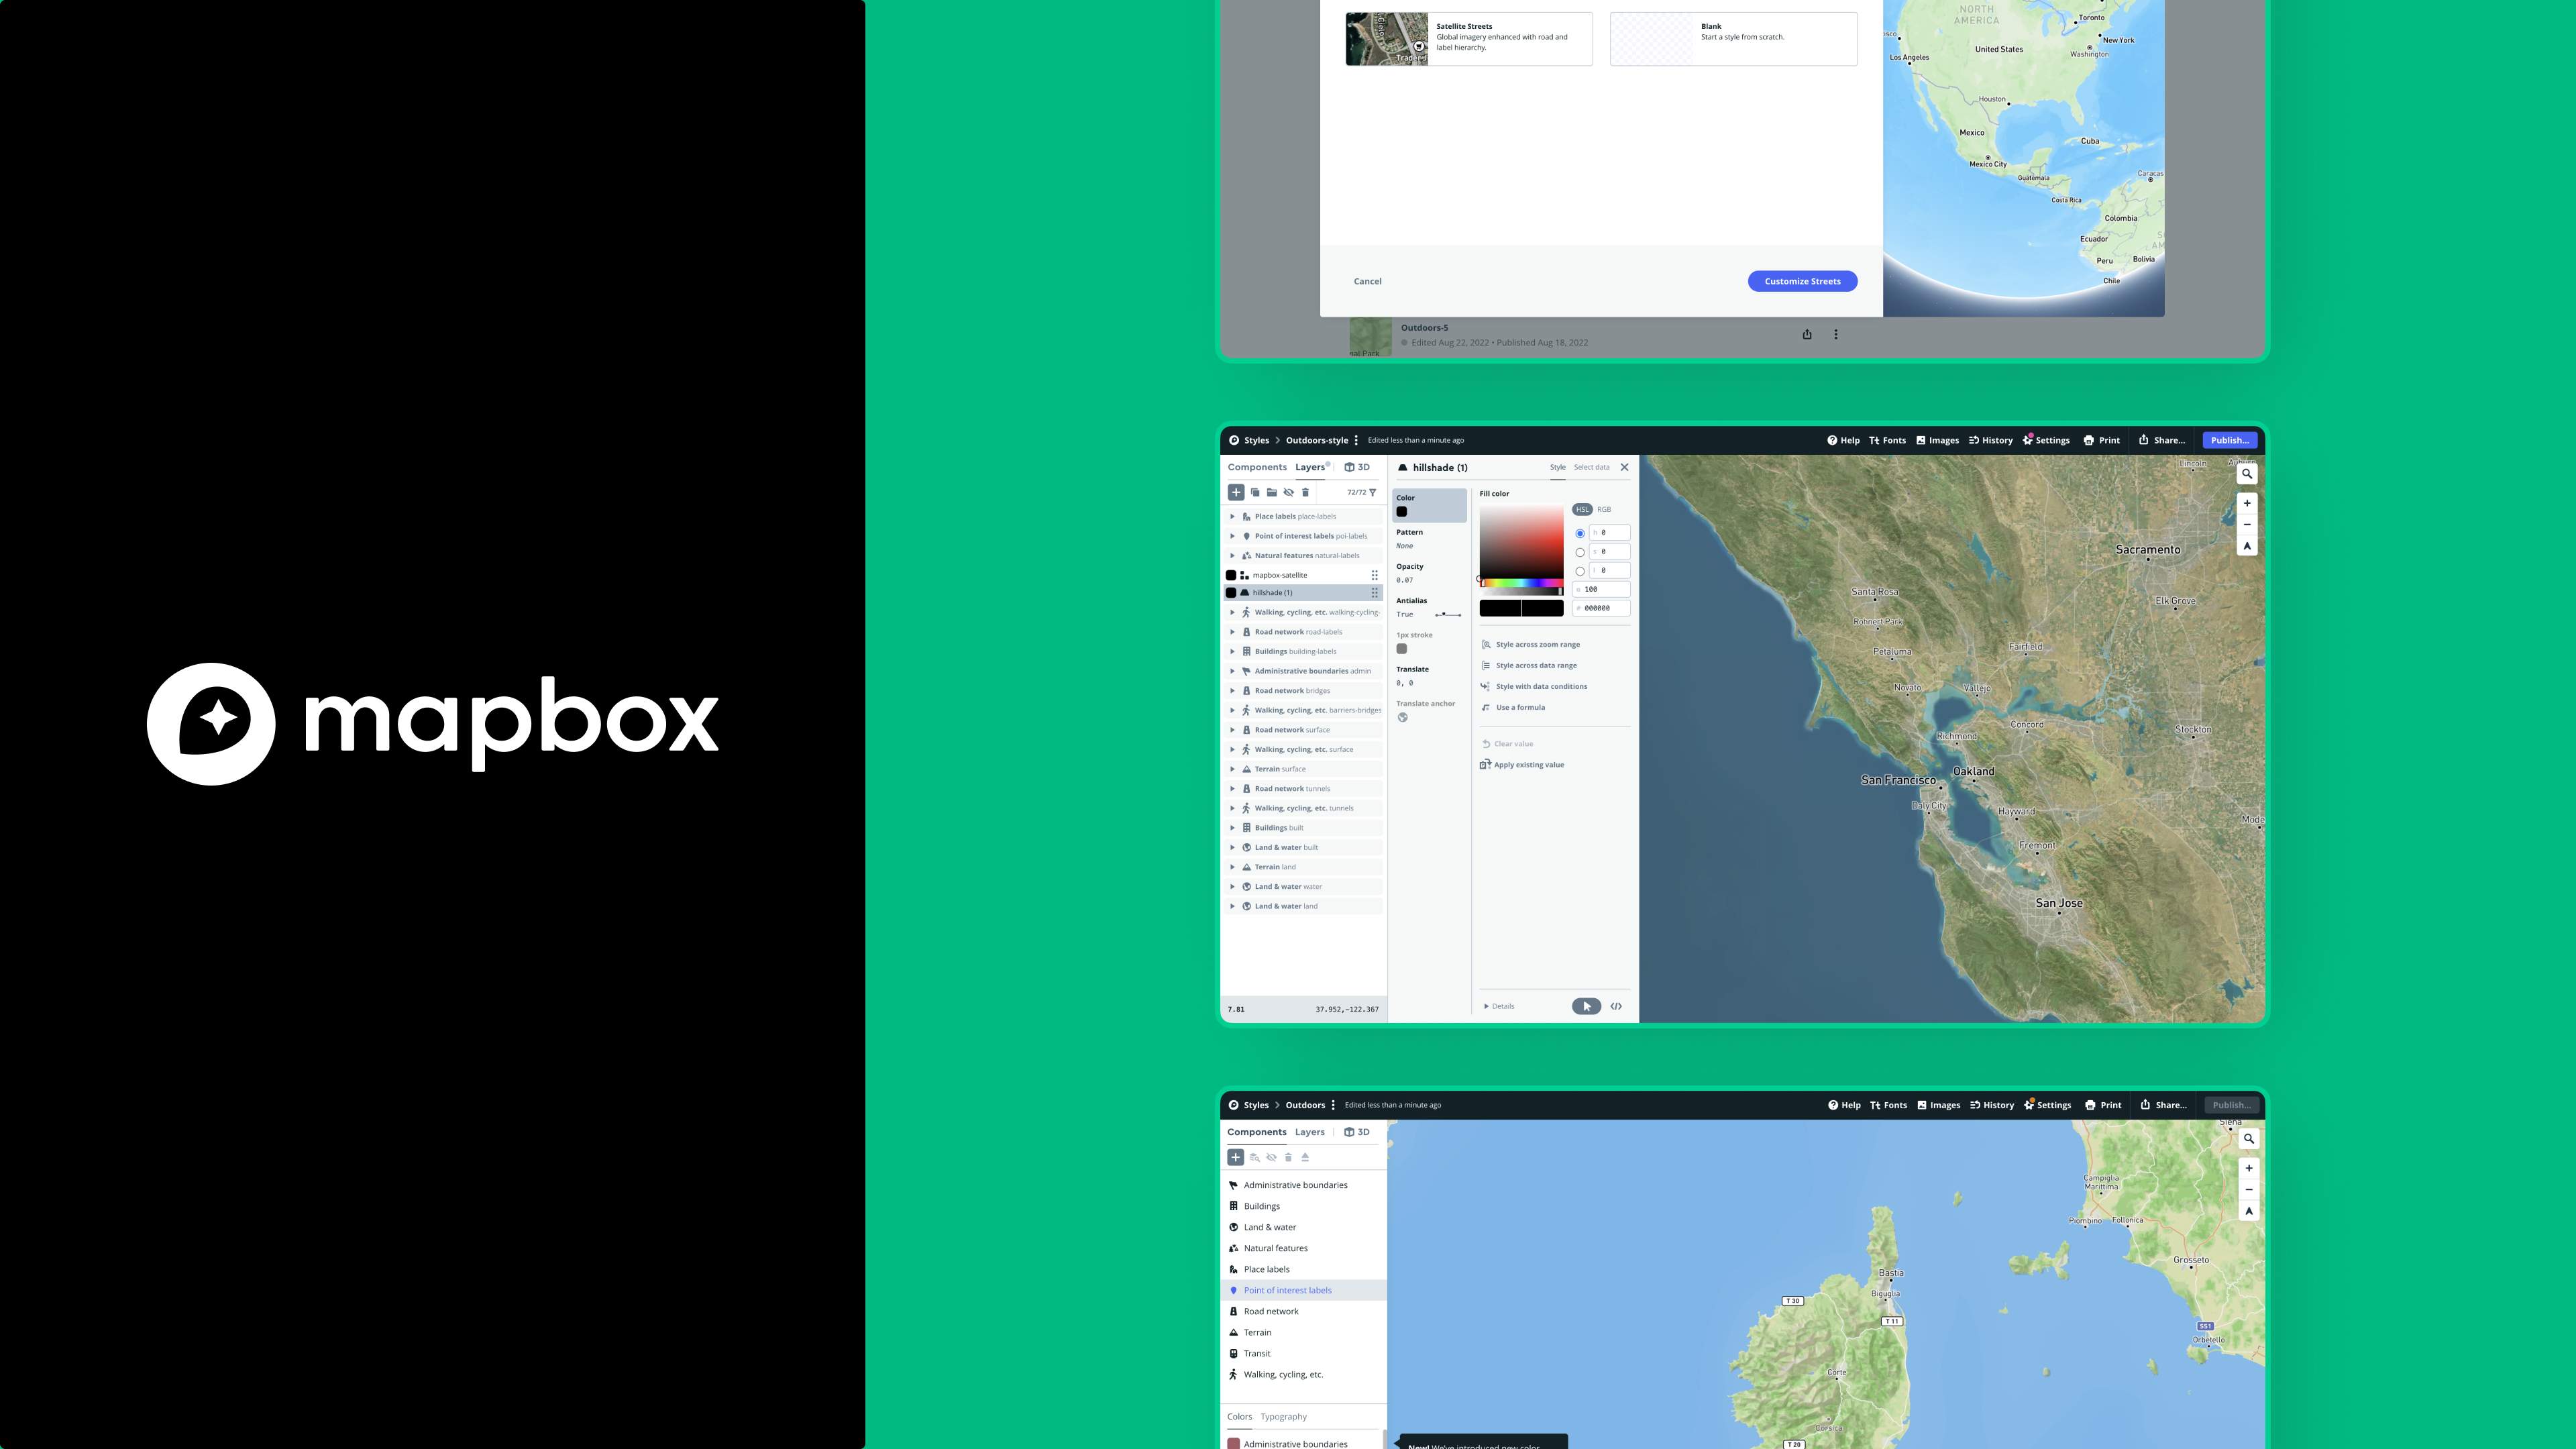
Okay, let's create our first style. After clicking the "Create a map in Studio" button, we will be taken to the main Mapbox Studio panel.
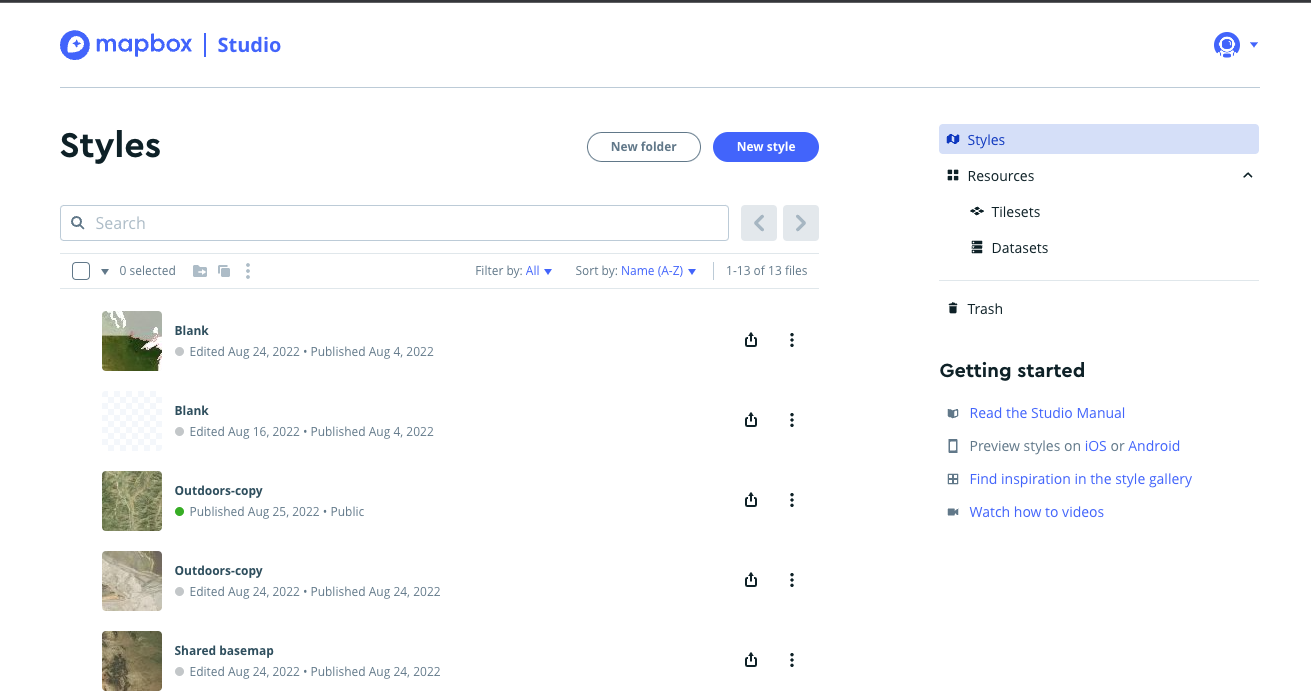 Mapbox Studio panel. Source: Mapbox
At this point, we can browse, create, and organize our styles, datasets, and tilesets. To create a new style, we must click the New style button. We will be able to choose whether to base our new style on one of the ready-made styles, such as Outdoors, or create a new one totally from scratch.
So click on the blank template, and then Customize Blank. The first thing we see is an empty, white board with a sidebar divided into three main sections: Components (we will come back to this later), Layers and 3D.
Let's assume first that our new style has the following requirements:
- the base is a satellite view.
- mountain ranges are not meant to look flat, but without adding 3D layers. Performance is important to us.
- in addition, we want the color of the water to vary depending on depth.
Let's start with Layers. In this tab, we can add new layers to our map. From our requirements we know that our map has to be a satellite. So let’s click on the plus icon and in the drop-down menu enter "satellite”.
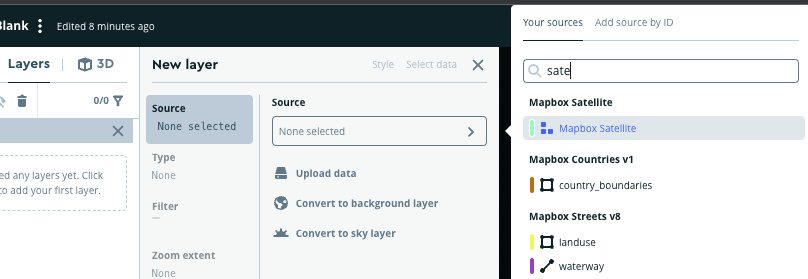 Satellite layer configuration. Source: Mapbox
Choose the Mapbox Satellite layer and click on the Style tab. We have the ability to configure our layer, change the opacity, brightness, contrast, etc. I recommend playing around a bit and seeing how the layer responds to changes.
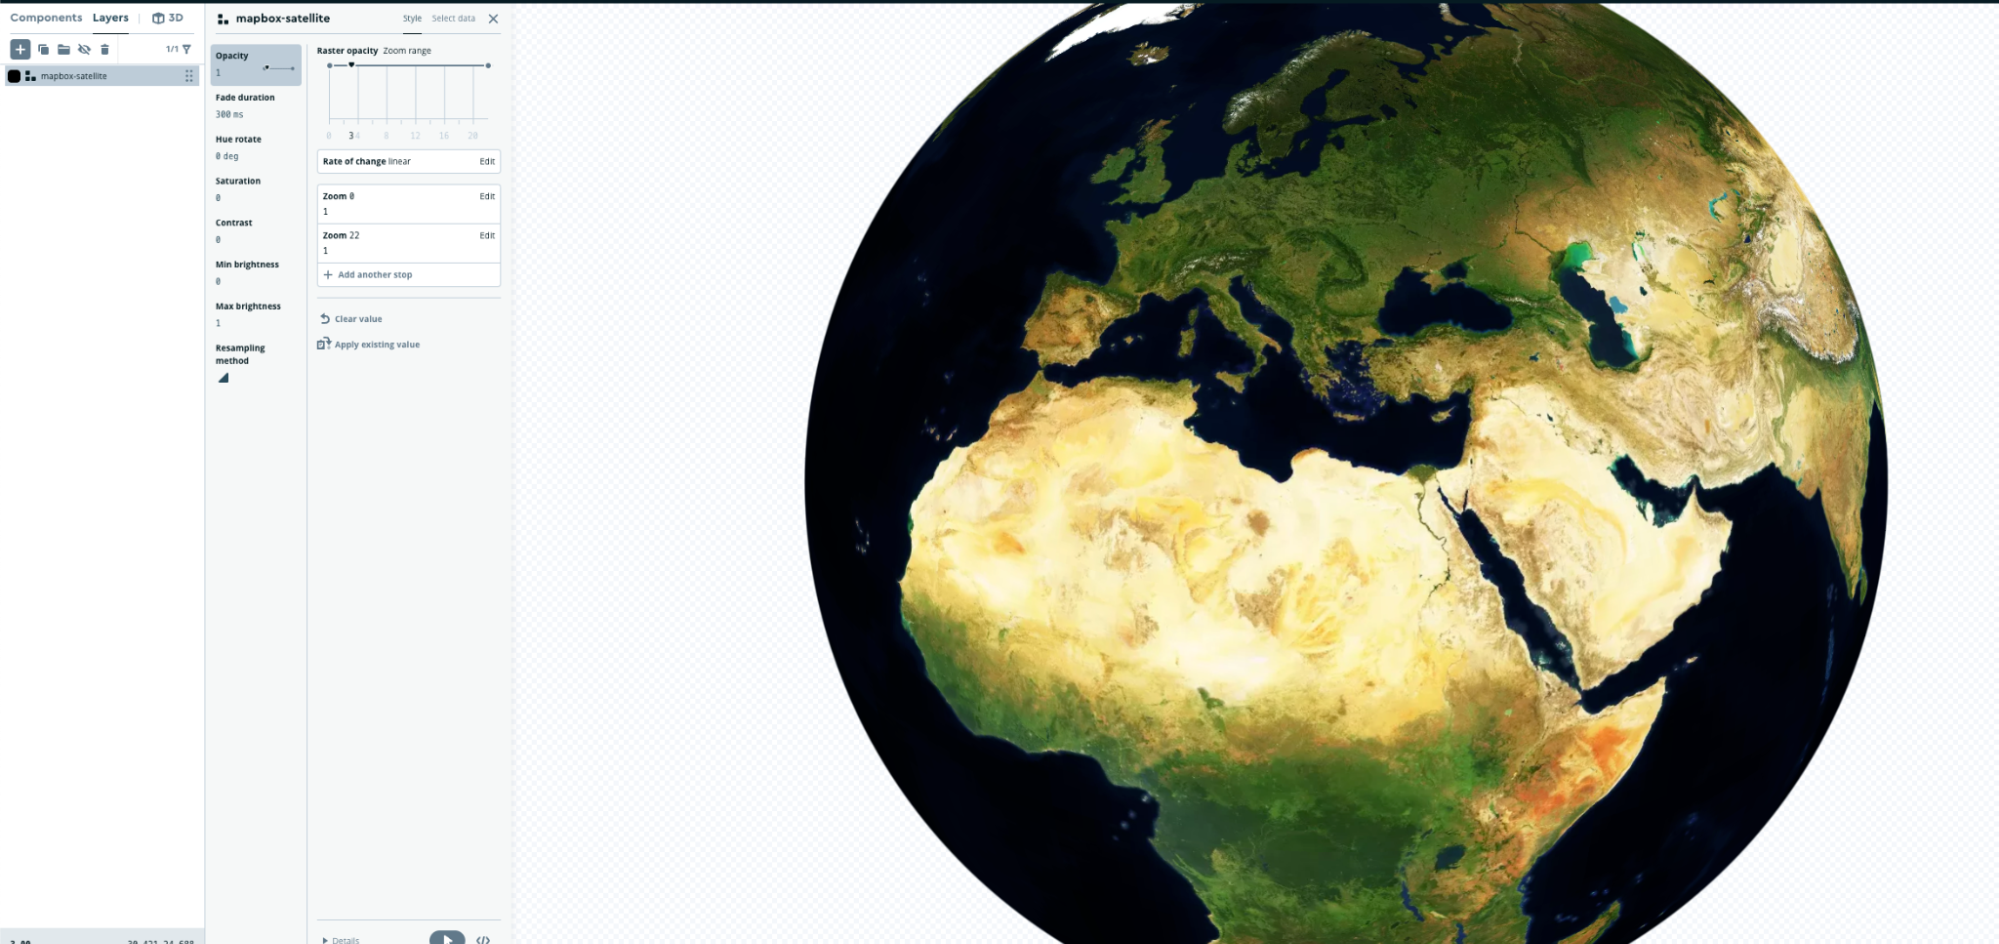 Satellite view. Source: Mapbox
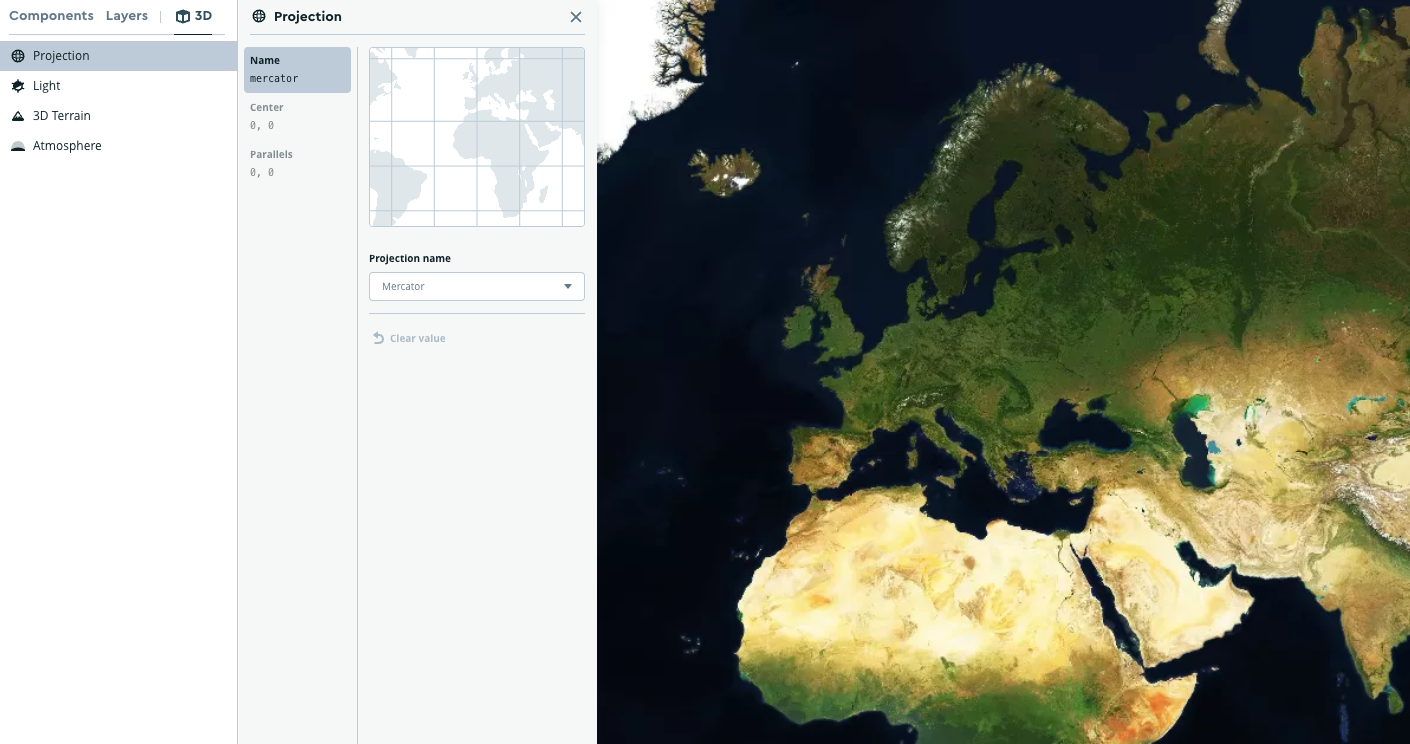
As we can see, there is our satellite view! Ok, but it just so happens that we don't want our map to be a globe. In the 3D -> Projection tab, we have the option to choose from one of 8 map types such as Globe, Natural Earth, or Mercator, which we will actually choose.
 Projection types. Source: Mapbox
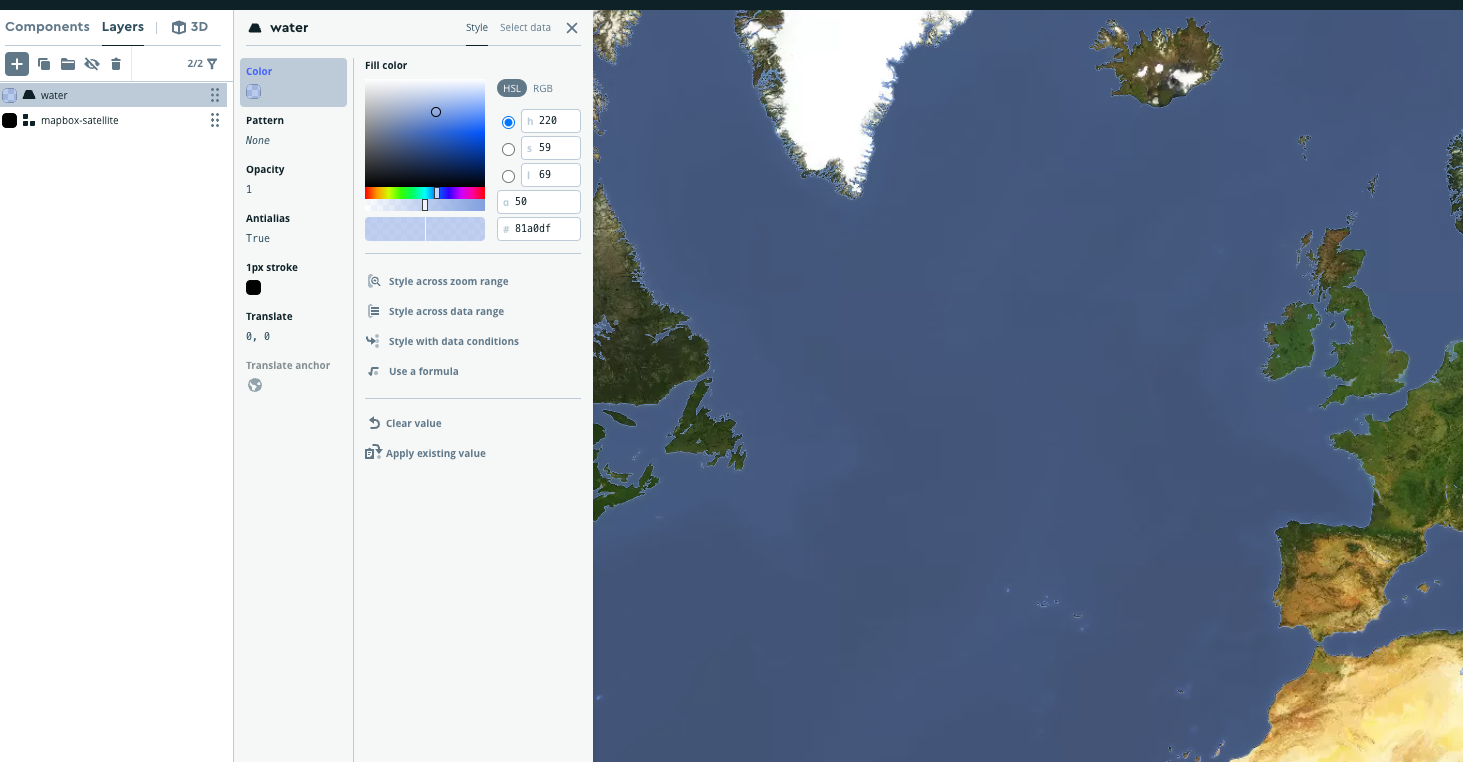
Great, we got it. It's noticeable right away that the overall color of the water is, how I should say it, dark. So, let's change that. Similarly to the satellite view, click the add button and search for the layer, only this time enter water. Let’s choose the layer and set its appropriate color. Let's also change the opacity so that the original appearance of rivers and lakes from satellite view is also slightly visible. It is important that the new layer is above the satellite layer, otherwise it will not be visible at all. Unless we change the opacity of the satellite layer.
 Mercator projection type. Source: Mapbox
Ok, so now instead of black water, we have it lighter, but it's still some ugly blue… No worries. It's just our base. We will now add a new layer that will make the water a different color depending on the depth.
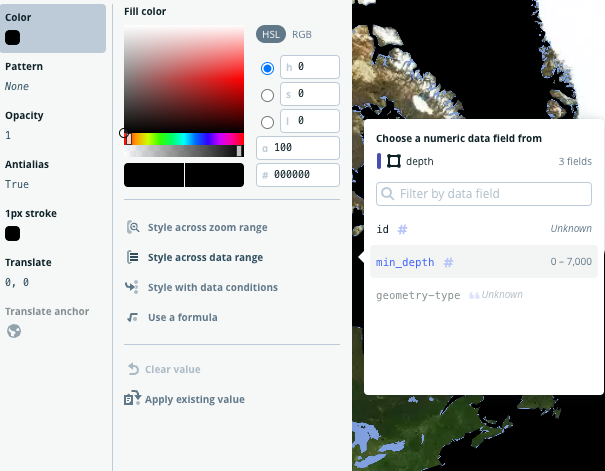
Search for a layer called depth and add it. Remember to put it above the previous layers. We now need to set the appropriate color depending on the data_range. So click on Color -> Style across data range -> min_depth.
 Water layer. Source: Mapbox
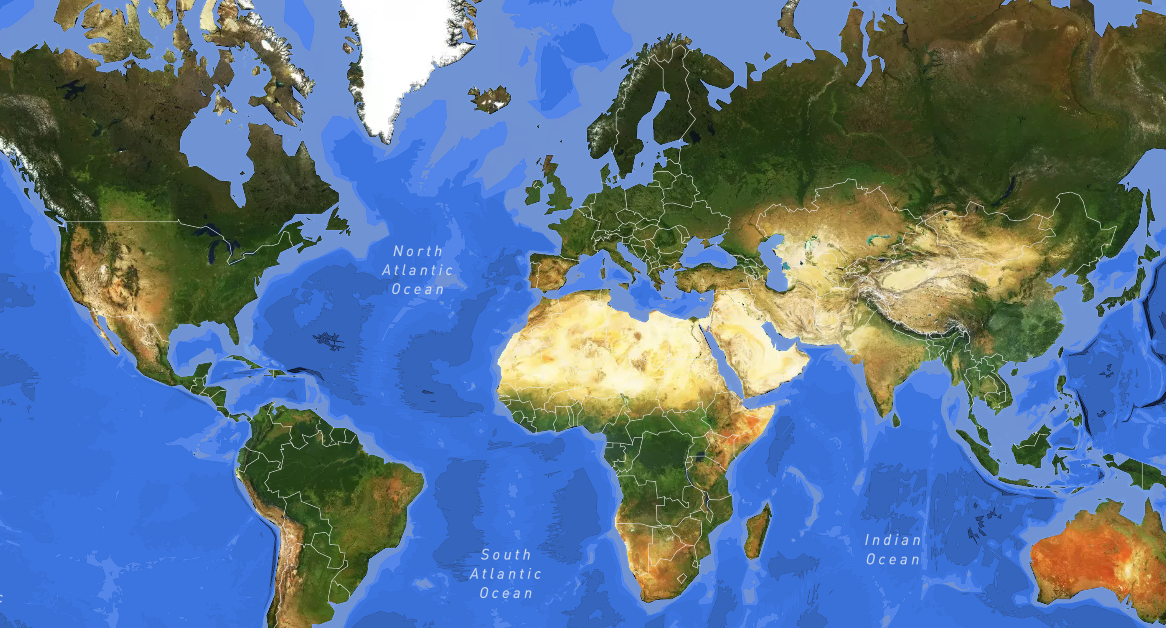
Set the color for the min_depth and click done. We can now add additional steps by clicking Add another step, setting the minimum value of the range, and selecting the color. For me, it looks like this:
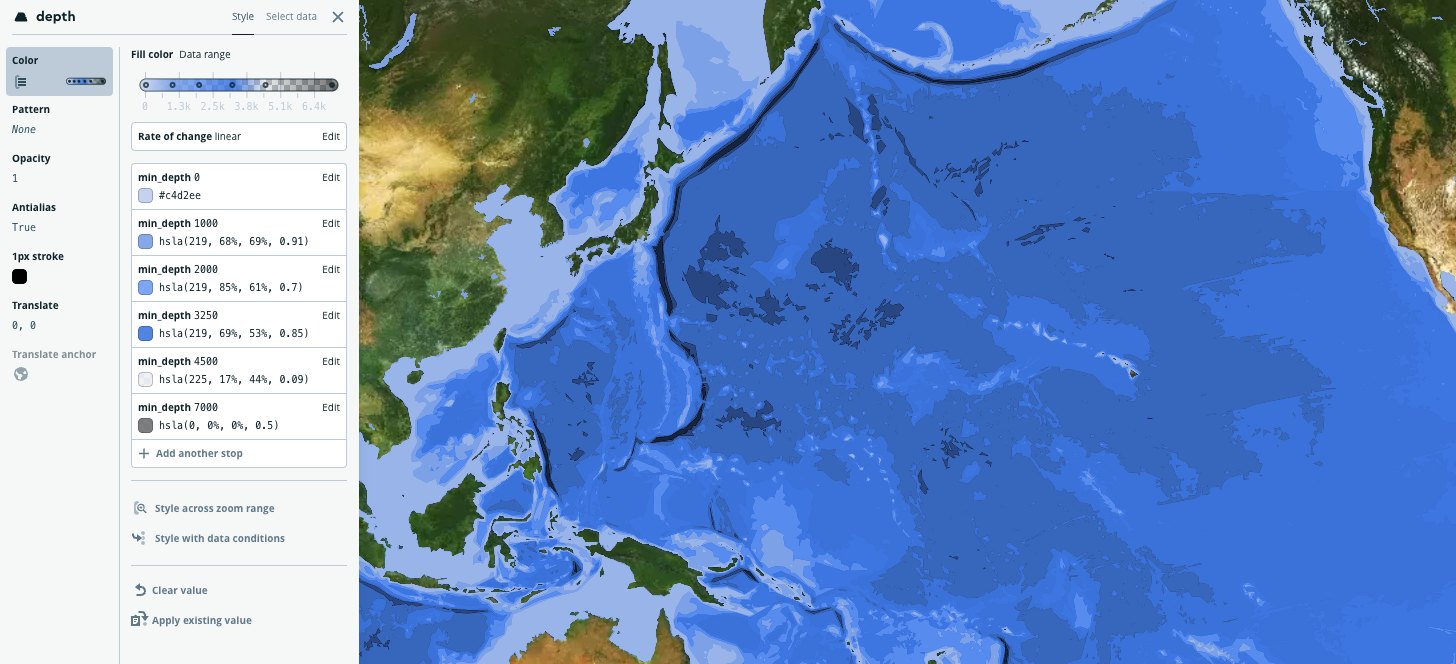 Water layer configuration. Source: Mapbox
We got it! We can now see which regions of the Pacific are the deepest. Let's do something else with the appearance of the mountains.
As we remember, in our assumptions, we stated that mountain ranges should not appear flat. Thanks to the fact that we are using a satellite layer, we have this in a way already, but not exactly how we want it. Let's search for the hillshade layer and add it. We should also change the opacity because without transparency, the layer is definitely too dark.
>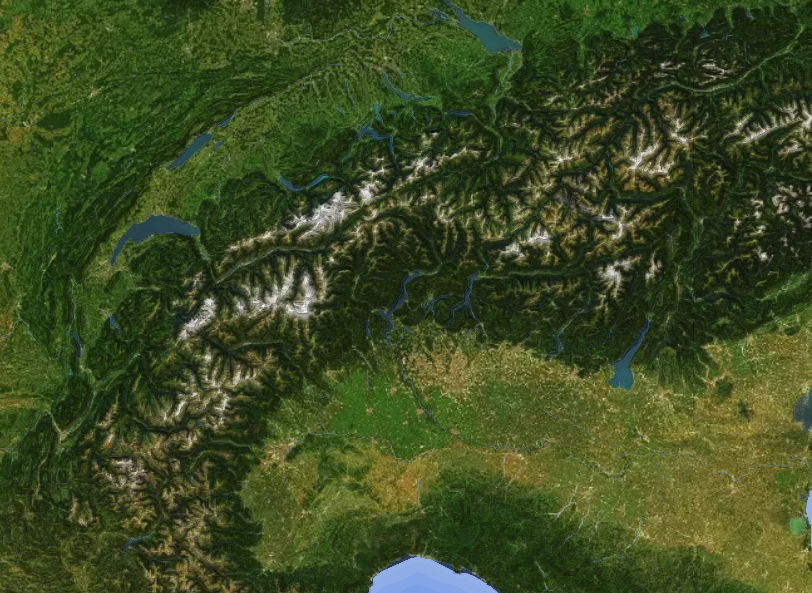 Hillshade layer. Source: Mapbox
As we can see above, the Alps have definitely gained more depth. I said earlier that we will return to the Components tab. Let's do that now.
In the Components tab, we can also add new elements to our style, similar to the Layers tab. The difference is that there are ready-made sets of components, made up of many individual layers. So let's add a component called Natural features. It consists of many individual layers e.g names of oceans. The added component is immediately visible in the layer tab. We have to put it at the top of our layers.
Let's also add another component. This time it's Administrative boundaries. Let's stylize everything a bit. The final result looks like this:
 Administrative/Natural components. Source: Mapbox
As I mentioned earlier, I strongly recommend experimenting with the available options. The possibilities are enormous.
Mapbox also gives us the option to upload our own layers. Do you want to show the locations of all electric vehicle charging stations in the USA? No problem. All you have to do is upload your own dataset instead of selecting from the available layers, for example in GeoJSON format. You can search for sample datasets online. There are many websites that offer data for free.
Okay, we have our style. To use it, we must first publish it. In the top right corner is the Publish button. Click it, then click at Publish as new. In the main panel of Mapbox Studio, the new published style should appear at the top. After clicking on the 3 dots on the right, we will have the option to copy the Style URL which will be needed in the next part of the post.
How to integrate Mapbox with the Next.js project suing Mapbox GL JS library?
Mapbox GL JS is a client-side JavaScript library for building web maps and web apps with Mapbox's modern mapping technology. It can be used to display Mapbox maps in a web browser or client, and to customise the map experience within your app.
To use our freshly created style in a Next.js project, we must first create this project.
On the Next.js website, we will find instructions on how to generate a basic project setup.
Let's do that. Open any editor and follow the instructions. When the project is created, remove the unnecessary things from the pages/index.tsx file so that it looks like this:
Run the application as usual with the npm run dev command. The project should be available at localhost:3000. To display our map, we must install the Mapbox GL JS library. The installation command can be found here.
To make things easier for us, also install the React-map-gl package, which includes a set of components that make it easier to integrate with Mapbox. This is not necessary, however. The link to the npm page can be found here.
Okay, we have everything. In the main project directory, create a components folder and a Map.tsx file in it. We will place the code related to our map here.
Create a Map component. Then, import the map component from the react-map-gl package and render it. Set the size of the map to the full page, the default map style, and the initialViewState. The whole component should look like this:
Import our new component in the pages/index.tsx file. Remember to also import the styles in the _app.tsx file.
However, when we open the browser, we will notice that our map does not appear and we will see an error instead. This is because we did not set the appropriate token with which our component could authorize itself.
To do this, we must first create it. Let's go back to the main Mapbox application panel. In the center of the screen, we will see the following module.
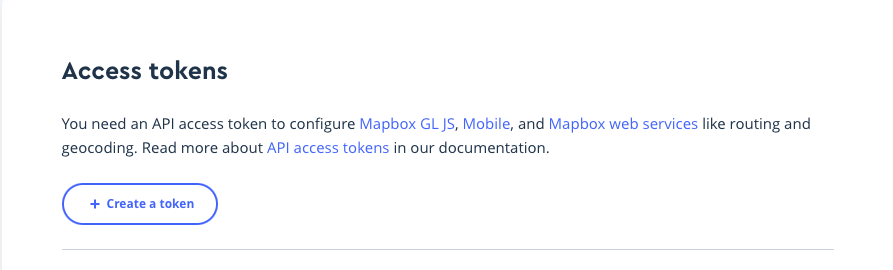 Access token. Source: Mapbox
We have the option to create a new token or use the default access token. However, we must remember that the default access token will not work in a production environment. In our case, it is sufficient. Let's copy it and add it to the map component as mapboxAccessToken prop. Remember that authorization tokens should not be stored directly in the code, as in the following example. The safest way is to create a .env file and keep all variables that should not be in the repository there.
Now, let's open the browser. We should see a map with one of the basic styles provided by Mapbox - the streets style.
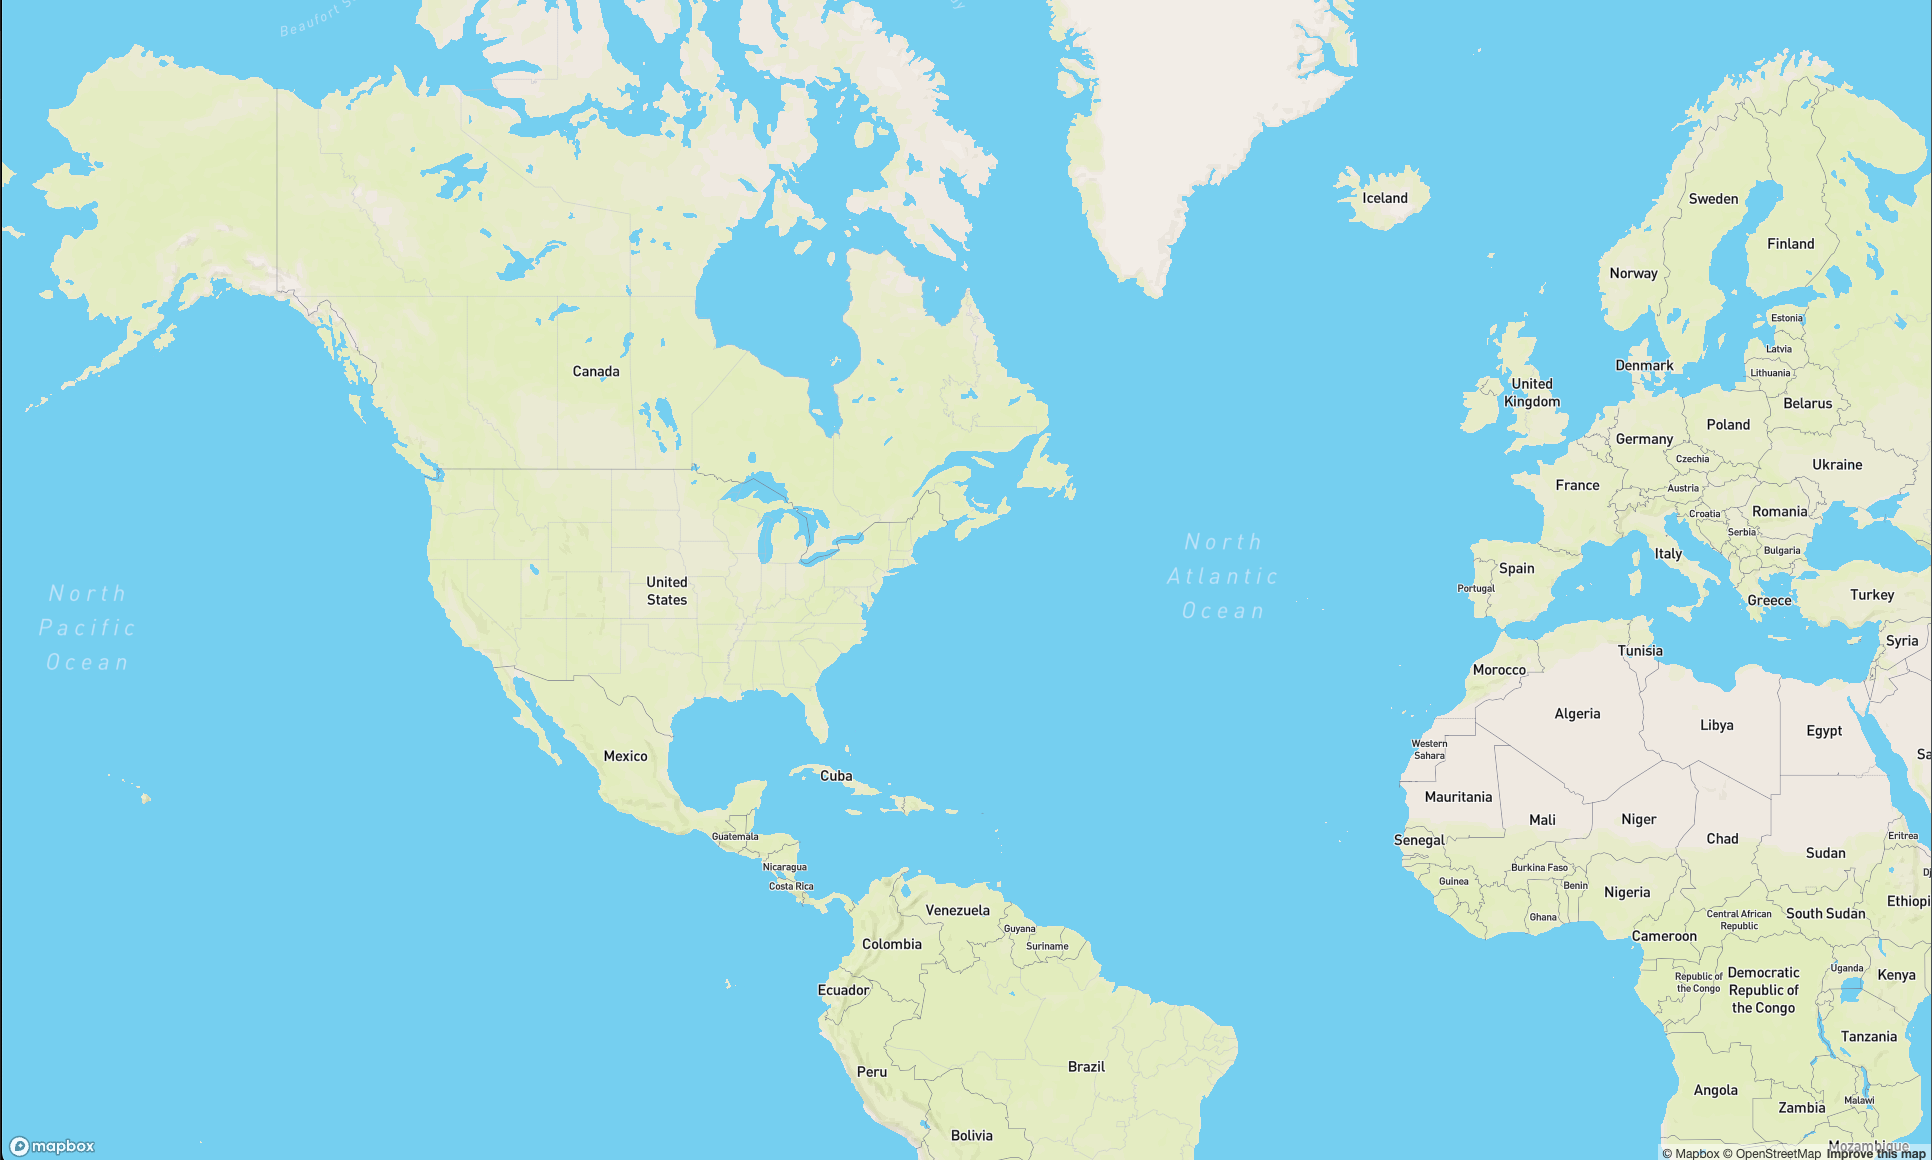 Outdoors map style. Source: Mapbox
However, we have our own cool style and we would like to use it. No problem! Let's go back to the Mapbox Studio panel and copy the link to the style that we published earlier. Now, set this style by replacing the mapStyle prop in our component. And we got it! Our own style works!
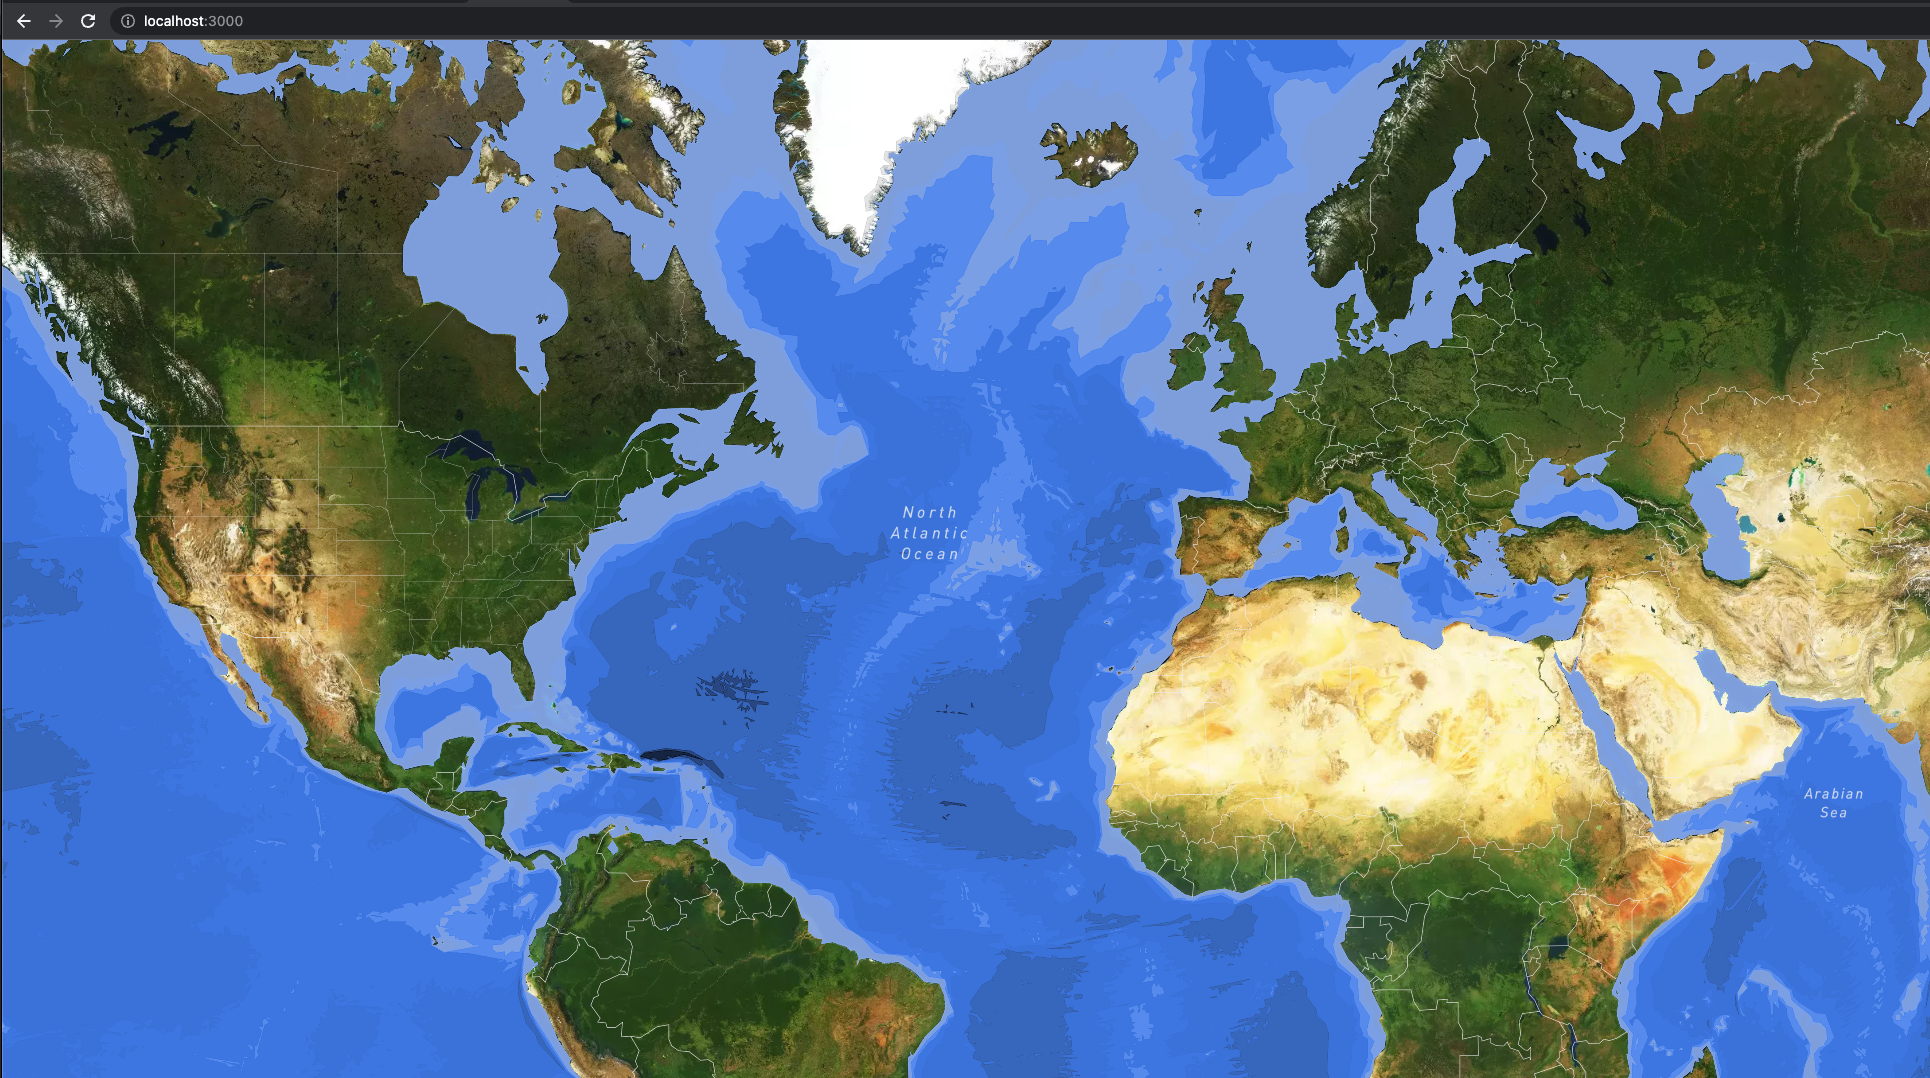 Our map style. Source: Mapbox
Final thoughts
As you can see, the Mapbox Studio tool and final setup with Next.js framework are not difficult at all. We also don't have to create all the layers at once in the panel. As mentioned in the introduction, Mapbox allows us to add dynamic layers from the code level as well. More information on this can be found in the Mapbox documentation.
Mapbox vs Google Maps. Which one is better?
So, how does Mapbox compare to the competition? Is it worth using when there are tools like Google Maps? Or is Mapbox a better tool?
As always, the answer is - it depends!
Both Mapbox and Google Maps are excellent tools for visualizing maps, and each one of them has its own individual features that make it better than the competition in certain situations.
Mapbox, which I have tried to show in this post, is often considered to be more flexible. It has a huge number of tools, including the ability to create custom styles. The service also seems to be significantly cheaper and documentation is very developer-friendly.
On the other hand, Google Maps is probably the largest provider of maps on the market. It is often said that the accuracy of maps provided by Google Maps is much higher than the competition. In addition, using Google Maps allows for integration with other Google services, which are numerous.
So it is hard to say definitively which provider is better. The decision to choose a provider should therefore be based on individual needs.
Check out also
- How to Improve Core Web Vitals of Your Website Using Next.js — Next.js gives us hybrid static & server rendering, automatic code-splitting, image optimization, and more, while being fairly easy to pick up. You can improve Core Web Vitals just by using it properly.
You may also like

The Cost of Waiting: How Refactoring Your Legacy App Prevents Massive Technical Debt in 2026
31 May 2026 • EL Passion

One Partner, Full Delivery: Why End-to-End Agencies Beat Fragmented Teams for Speed-to-Market
31 May 2026 • EL Passion

We’re available for new projects.
