


Chapters
Have a look into the research process we conducted for Betterworks, one of the best HR performance management solutions out there. Plus get some freebie resources.
Research is the first step in the Double Diamond design process and in all other existing frameworks. It’s essential for designers because they need to know the problems that users meet, their goals, and how they currently overcome some obstacles. It is also beneficial from the business perspective. Despite all the advantages, many product owners undervalue the power of talking to their customers. Luckily, we had a fantastic opportunity to do extensive research for one of our clients - Betterworks. In this article, I would like to share a case study showing how the research was conducted, and how it influenced the design of analytics in our client’s platform.
Introduction - info about the product and our cooperation
Betterworks develops best-in-class performance management solutions that enable exceptional results and put employee experience at the heart of how companies align, motivate, retain, and develop their people. Unlike monolithic legacy HR systems of record, Betterworks’ lightweight and enterprise-ready SaaS solutions for check-in conversations, feedback, employee engagement, and recognition are built to scale for businesses of all sizes.
As part of a larger effort to improve the overall user experience, I was assigned the task of redesigning the whole analytics module of the product. We realized we needed more information about where we should take the design, so we decided to do some research. It took us about five months, but we learned a lot! In this article, I would like to share our findings and some helpful resources you can use if you meet a similar issue with your product.
P.S. Before starting, I need to give a shout-out to Gosia Chomentowska, who worked with me at that time on this project and helped me plan the research process, create interview guides, and prepare all the essential documentation. Thank you so much!
Background - why we decided to do the research
Working on the new generation of the Betterworks platform made room for a lot of innovation or enhancements. I started cooperation with the Product Manager of Analytics to find a way to make all the analytics pages more useful. There were many ideas on what type of enhancements could be made - all of them were gathered from Customer Success and Support Teams, other Product Managers, and the Chief Product Officer of Betterworks. It was a great time to dig deeper into current usage patterns that CS Teams discovered and validate our assumptions with end users.
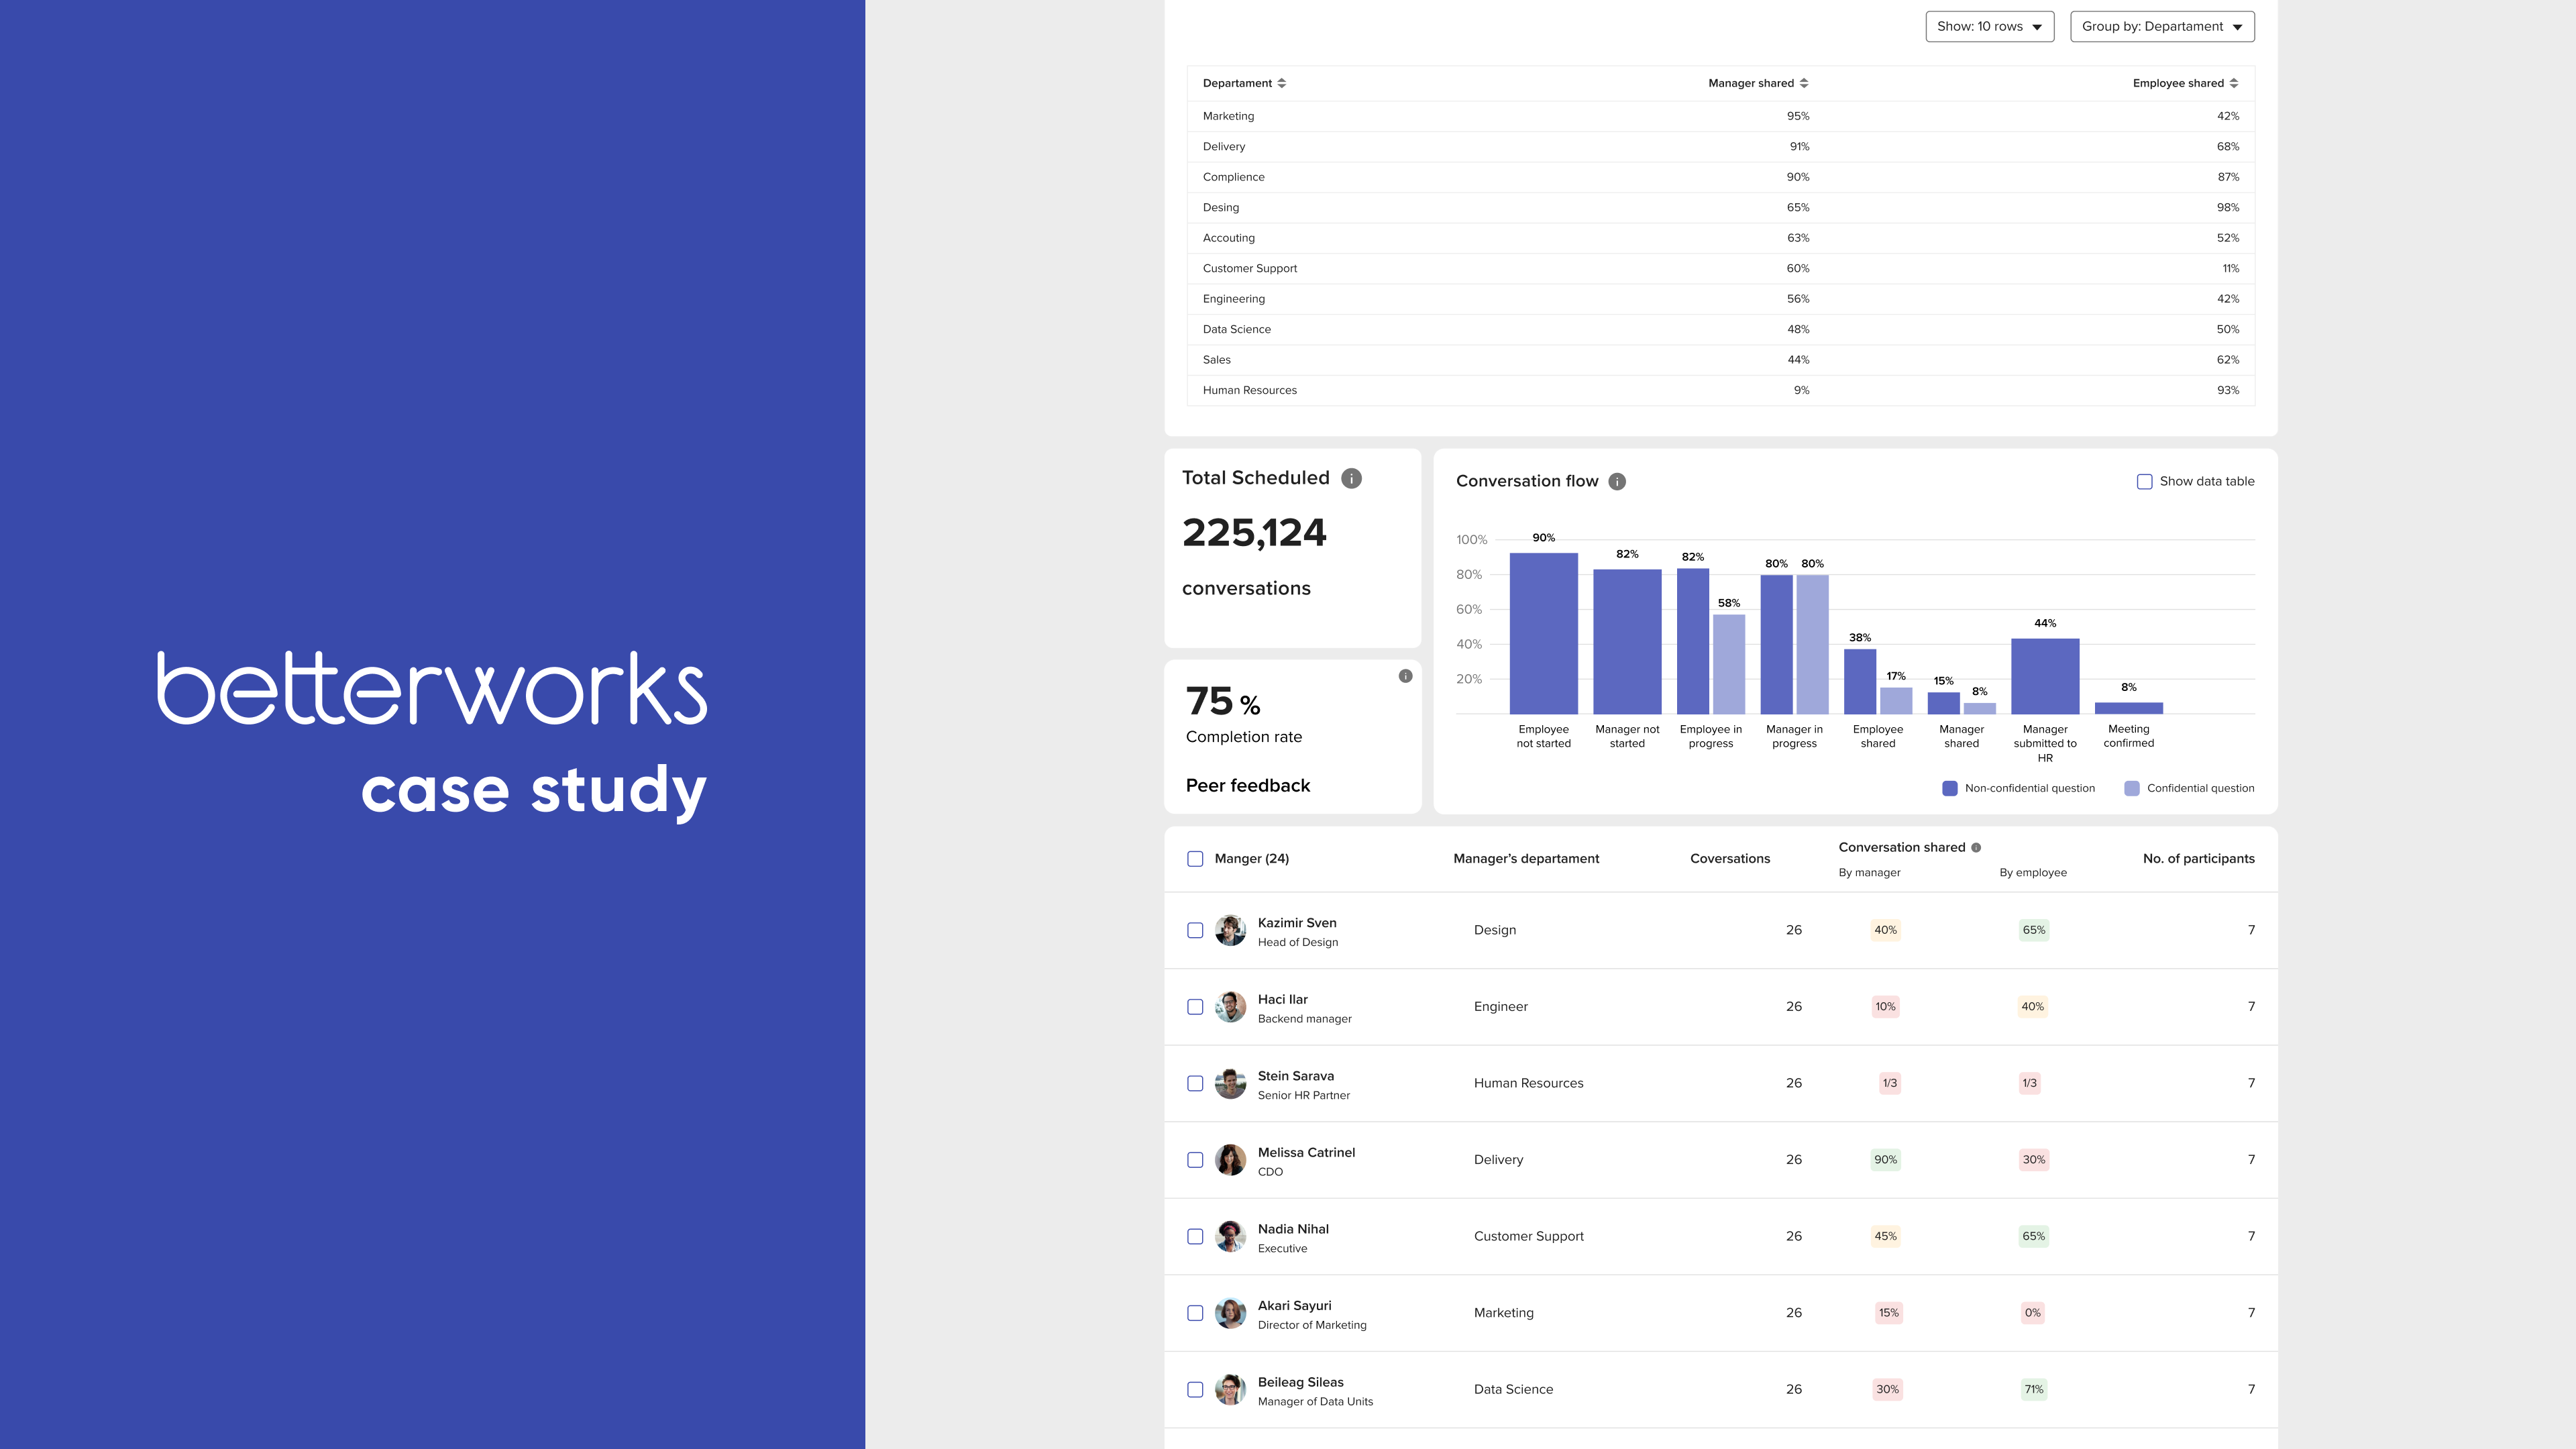
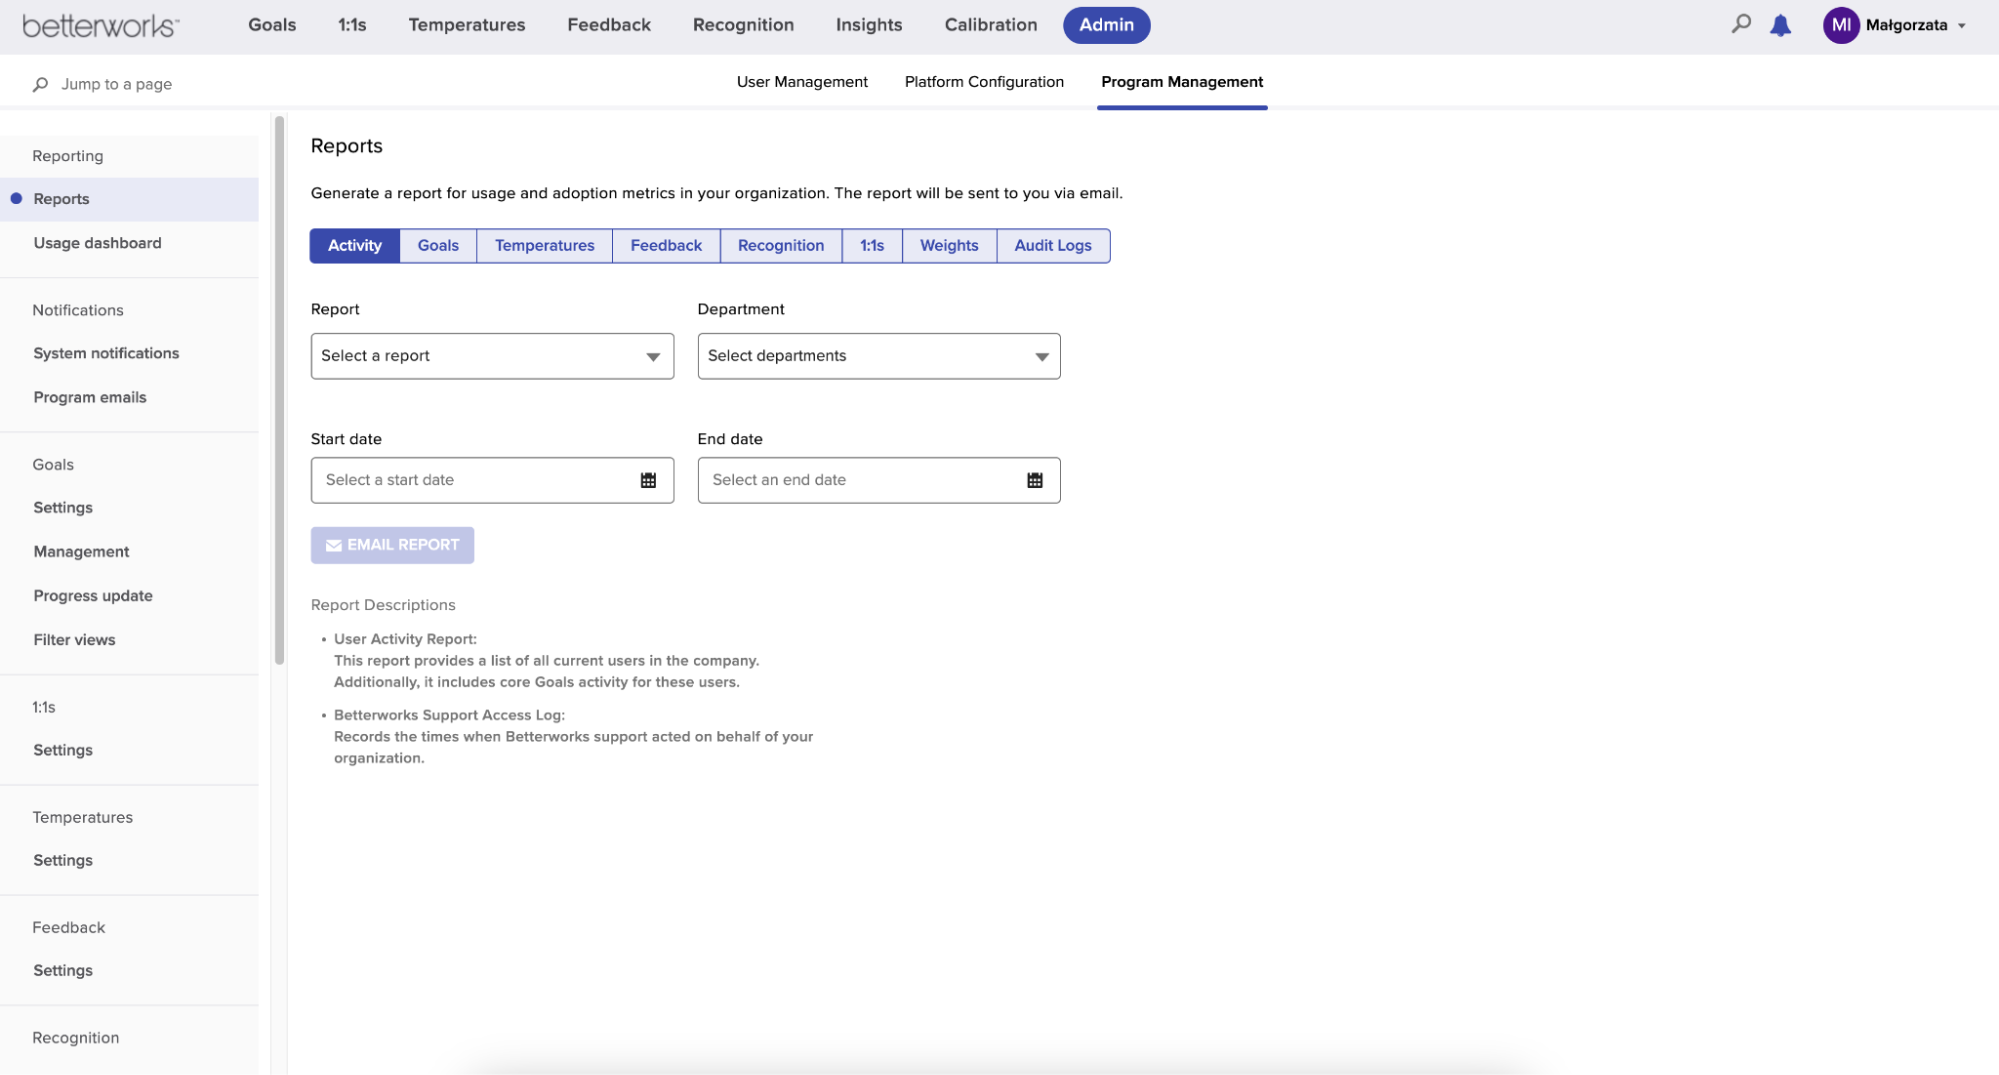 Image 1: Reports page, screenshot from my testing environment
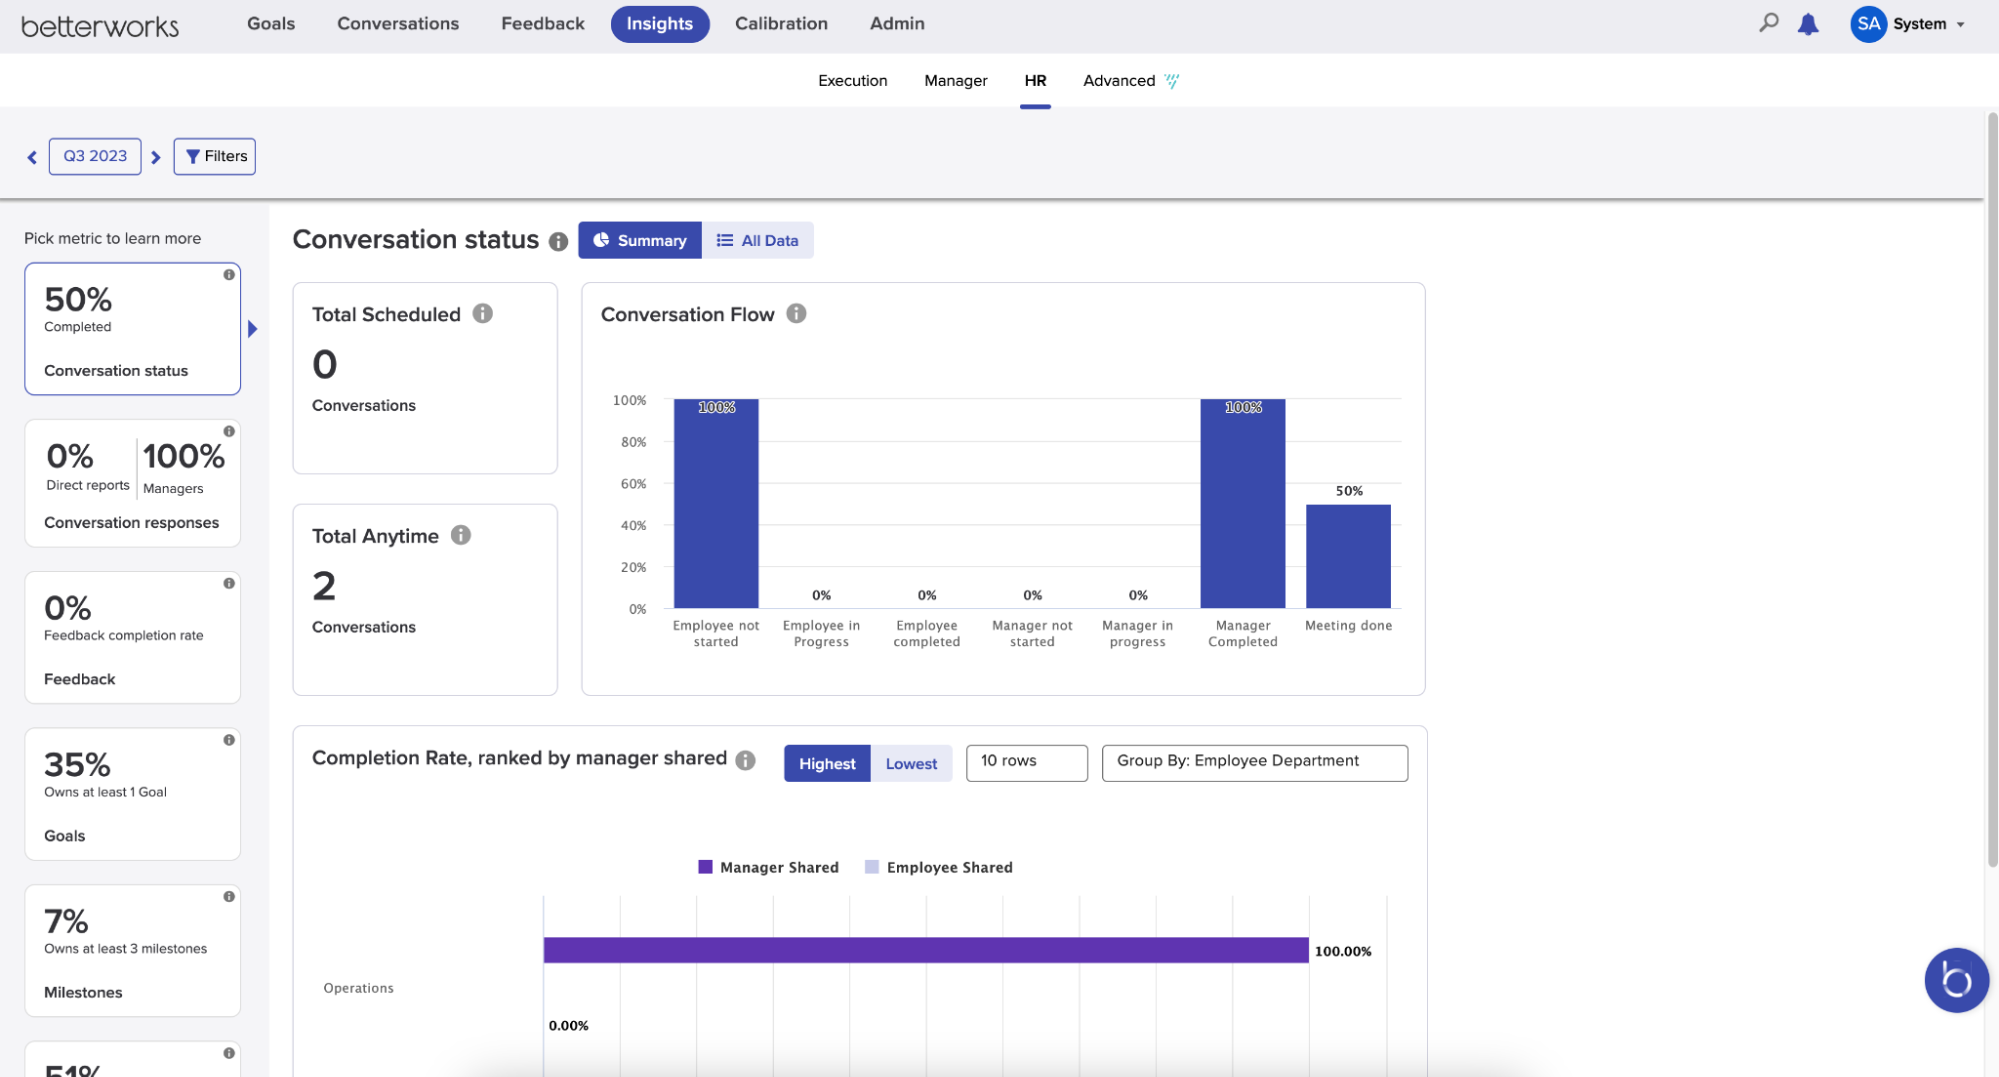 Image 2: Insights page, HR tab, screenshot from my testing environment
There are multiple places where users can find some analytics, but we decided to focus only on the most crucial part, where users can generate reports and preview the data on charts in a more visual form. The PM gathered information about users’ needs from the Customer Success and Customer Support teams. Product Managers and the CPO also brainstormed some ideas on how to enhance this part of the tool, and they shared their findings with me.
To help organize all the insights that I gathered and understand the product more, I conducted a UX audit of two reporting pages. In the audit, I marked the areas where enhancements would make the most impact, highlighted the potential user’s perspective, and added previously listed ideas on how to solve the problems.
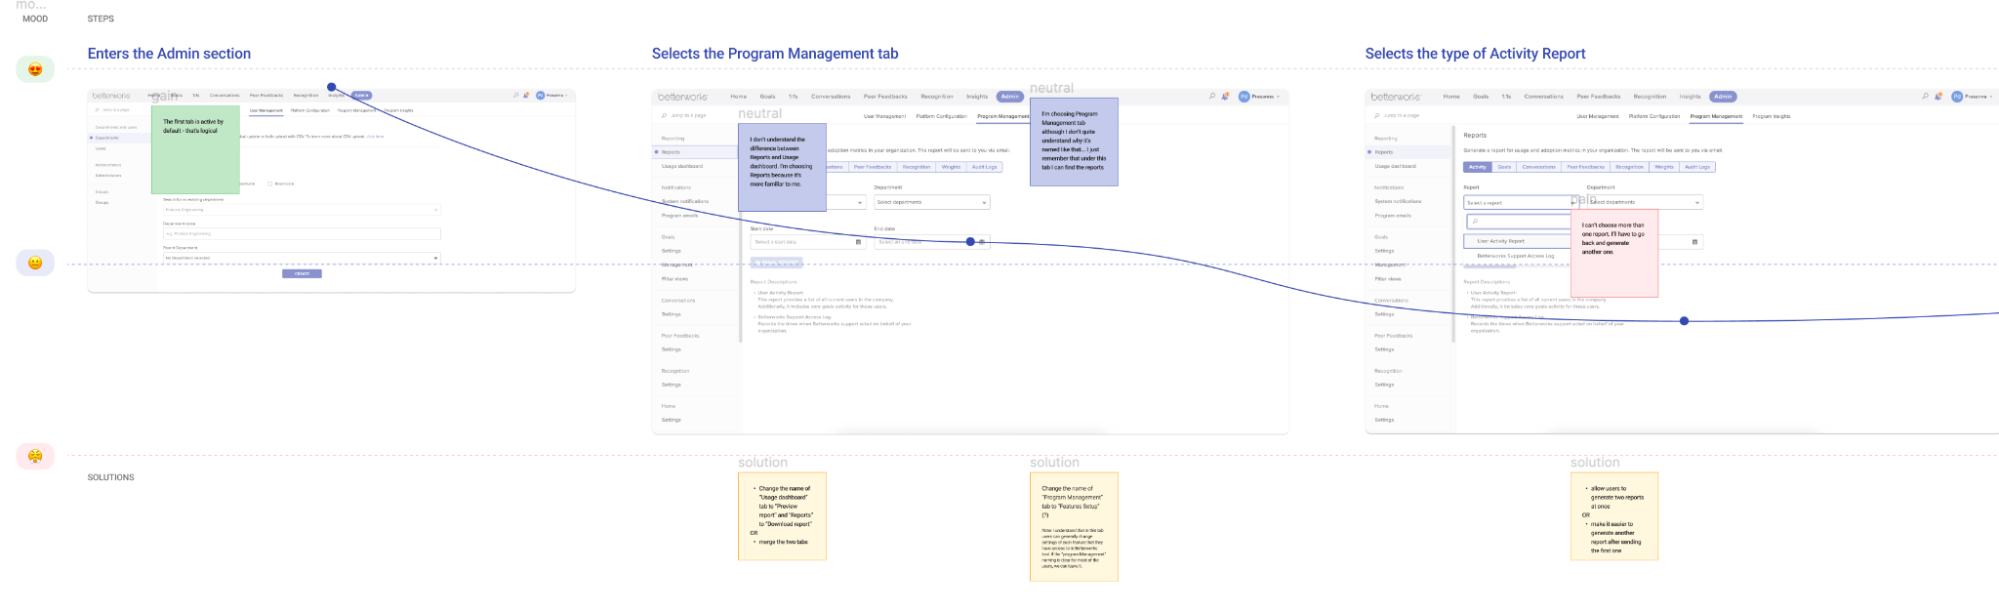 Image 3: Figma board, part of my UX audit of Reports and Usage Dashboard pages
I also conducted some competitive analysis, reviewing other tools that provide similar functionality. As I went through other tools, I realized I couldn’t go forward without proper research. I prepared lots of plans, estimations, and space for documentation. After a few discussions and meetings with PM, UX Team Director, CPO, and PM Director, we agreed to this plan:
- Analysis of all the analytics pages and comparison with other tools
- Internal interviews with Customer Success Managers and Specialists
- Interviews with Users
- Results - summary report
- Feedback from the Customer Advisory Board (CAB is a group of customers who regularly meet with my client to brainstorm ideas, share feedback, know first that some beta versions are available to test out, etc.)
- Internal co-creation workshops with PMs, Customer Support & Success Specialists and Managers.
Once we had everything set and approved, we finally launched the project.
Or check out the 🖼 FigJam Board template: Research Plan.
Final plan and execution - tools and methods we used
We decided to use the following tools to document and structure our findings:
- Confluence - for the notes from interviews, summary documents, and research plan
- Jira - for task management and monitoring the progress of our project
- Zoom - for meetings; all the interviews were recorded, and we put links in the document with notes
- Miro - for the co-creation workshop
- FigJam - to gather ideas and create the first low-fidelity wireframe
- Figma - for designs, gathering benchmarks, and all the information from initial desk research
We were able to utilize tools already in use by Betterworks, so there was no additional cost for tooling. Let’s go through the plan, then! I’ll dive deeper into our methods and show how we conducted each stage.
Benchmarks and competition analysis
I placed it as the first step, but in fact, that was the analysis I had to return to after the interviews as well. I kept all the screenshots in Figma. The most important thing about gathering benchmarks is to describe precisely what I like about them. Otherwise, I can easily get lost and forget the solution I planned to use and why.
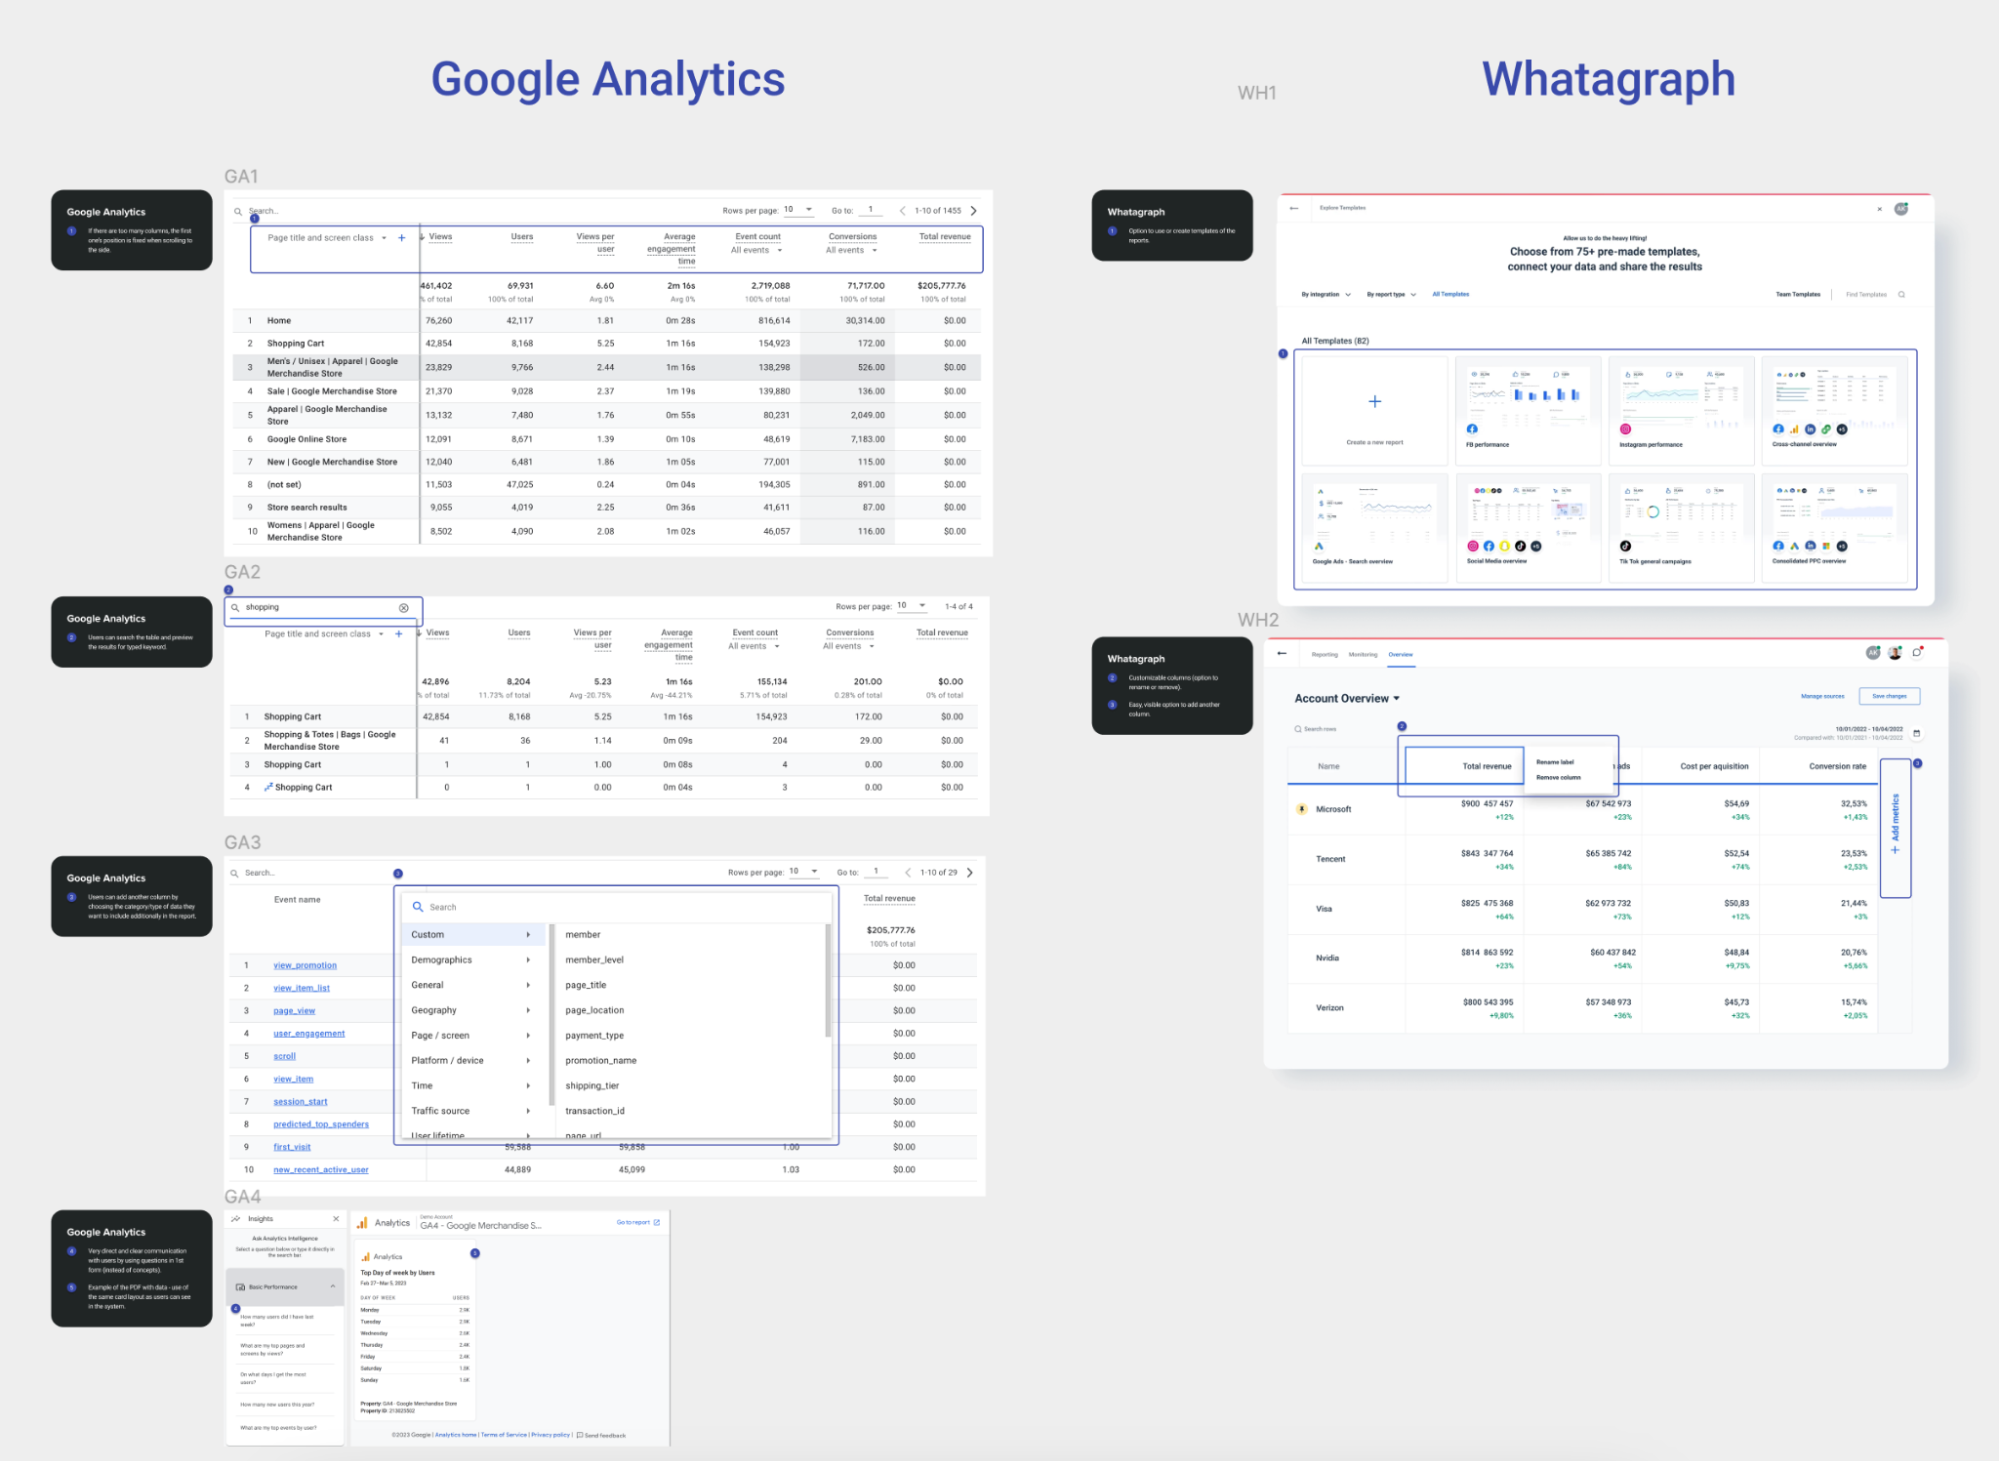 Image 4: Figma board, part of my benchmark analysis
As for the competitors, it was pretty hard to access similar tools since almost all of them are paid and unavailable for testing. I could only search for some guides, look at their websites, and use their screenshots. Additionally, I usually try to check the reviews that competitors’ clients post. I find the reviews especially helpful because they can give a good customer perspective. Clients usually write about some good features (which you can ask about during the interviews) or about things they need to achieve specific goals (which you can turn into your product’s competitive advantage).
When we were closer to the design phase, I also asked the PM to check the analytical tools he was using and share the solutions he liked. Thanks to that, I knew what he wanted to introduce or how he wanted to improve some features. It was way easier to talk about existing products than just discussing the general plans.
Interviews with Customer Success Managers
In the next step, we scheduled four meetings with Customer Success Managers and Specialists to get to know how their clients use Betterworks. The meetings combined in-depth interviews with them showing how their customers use the Betterworks application. They shared some ideas and needs from customers and also their own ideas about ways to enhance Betterworks. We focused on the most important topics:
- When and how often do users use certain features
- Why do they download some data, create reports, and what do they do with that information later
- Which metrics are the most essential for them
- What are the most common problems they’re facing, and how do they solve them
- How the Customer Success team helps their customers solve any issues
Our summary document was structured similarly to reflect the most critical information for us.
Interviews with Users
Now, knowing more about the users, we were ready to meet with them and check the hypotheses that we stated after the interviews with the CS team:
- There are different tolerances around performance based on the report type and usage
- Some pages or functionalities are rarely used
- Pages with charts and visual interpretation of the data are the most useful and clear for the users
- There are different models around who should have access to which reports
- Users are often pulling reports from multiple modules and then combining them into one to present them to their managers or directors
We met with eight different companies that are using the Betterworks tool. In most of the cases, there were more than two people. We had an opportunity to gain insights not only from the directors who are generating the reports but also from the managers who are monitoring their team's performance on a daily basis.
Those meetings had a similar structure to the previous ones: in-depth interviews mixed with demos where we asked our participants to show us the way how they usually act in the tool. We also asked them to show us what they did with the data so we were able to see how they used spreadsheets and presentations to use and manipulate data they obtained from Betterworks.
Or check out the 🖼 FigJam Board template: Interview Guide.
Summary after the interviews and the very first idea for improvements
Those two types of interviews significantly changed our way of thinking about analytics. Some decisions became obvious that had been completely out of our thinking at the beginning of the research phase!
First, we prepared a document where we put information about:
- Key points - some most important elements that could most benefit from enhancements
- Types of users and their goals
- Observations with priorities - some kind of rating that allowed us to sort them according to their importance quickly
- Ideas on how to address new requests or what to keep if it’s a good-working feature
Or check out the 🖼 FigJam Board template: Research Summary.
It’s important to include in the observation list - not only suggestions for enhancements but also positive observations about the product. By remembering to do this, I know I won’t be tempted to change things that work.
After the summary, I prepared some first low-fidelity designs to inform the Product team about the enhancements we’d like to suggest. Once they approved them, we were ready to share them with the Customer Advisory Board.
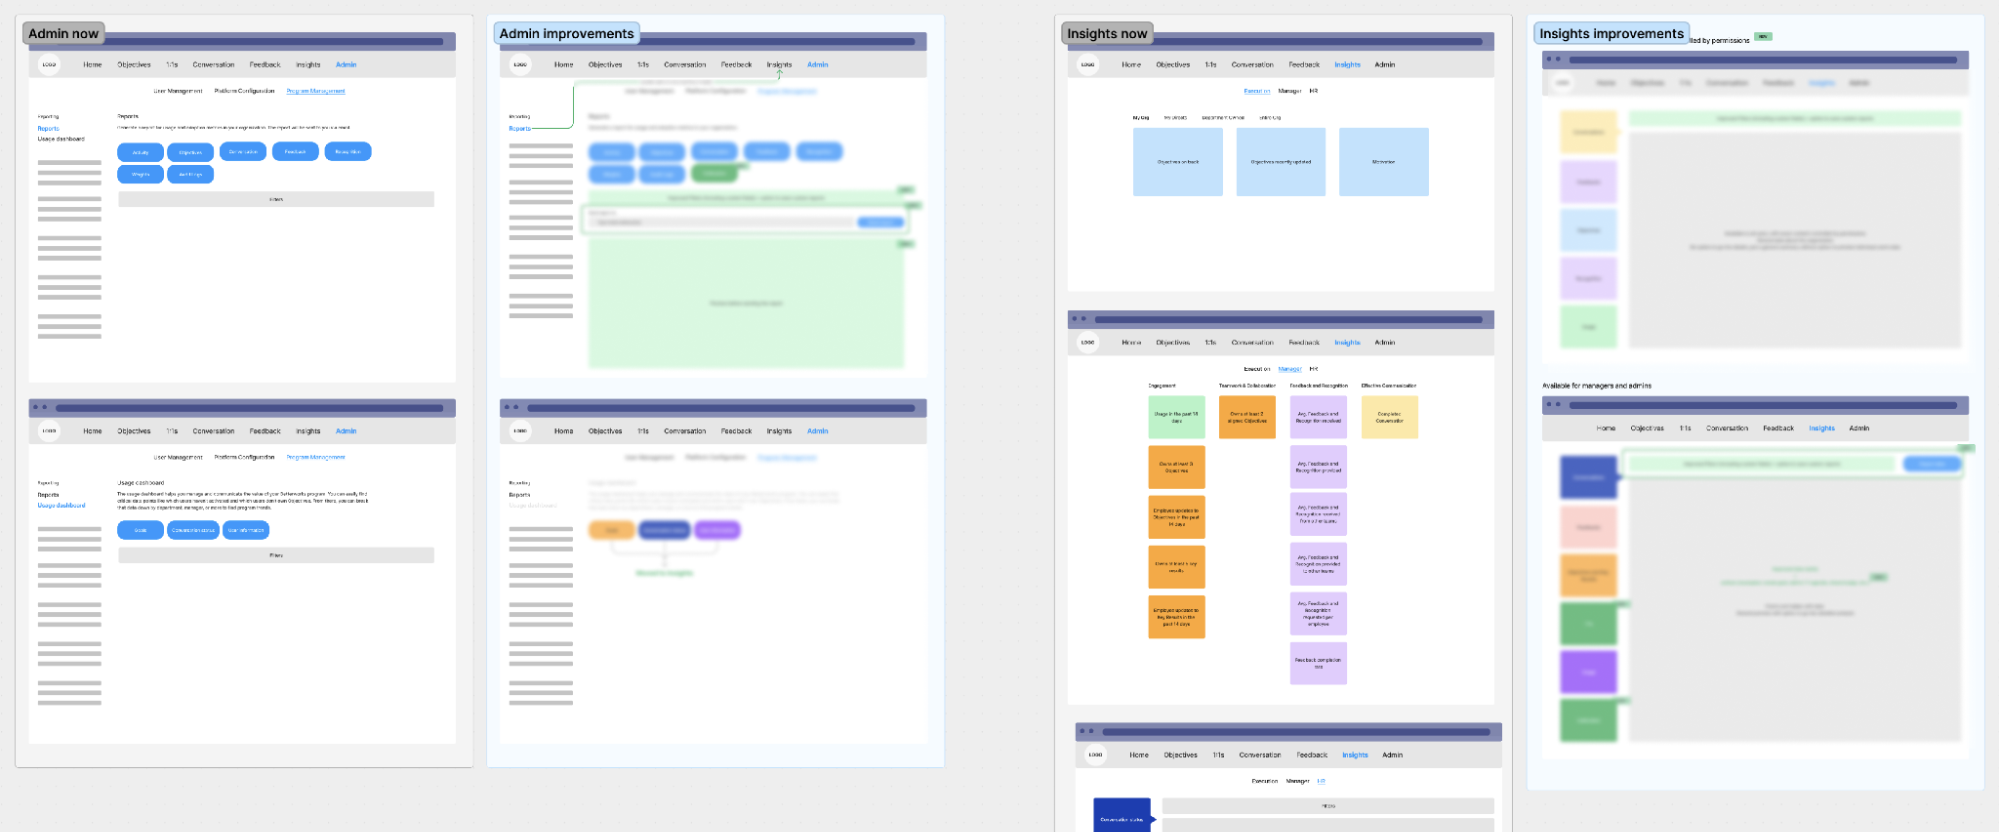 Image 5: FigJam board, part of low-fidelity wireframes
I also included the elements functioning in the tool at the time. The purpose was to highlight enhancements while indicating what will remain.
Customer Advisory Board (CAB) meeting
As I mentioned before, our client has a great group of users who work with them closely. The CAB is always willing to share feedback, they’re very engaged beta testers, and they’re the first ones to hear news about upcoming product changes. I had a fantastic opportunity to join a meeting where we (as the Analytics team) gave a presentation. We shared the results from our research and pointed out the essential enhancements we wanted to address. At the end of our talk, we showed low-fidelity wireframes illustrating how the architecture can change and where we plan to move all the reports.
We gathered their opinions and answered some questions. Once they had a positive response to our vision, we knew this was the right direction to follow. Success!
Co-creation internal workshop
After all the meetings and interviews, when our idea was more or less shaped, we decided to go back to the CS team we interviewed before and inform them about the results. But, since the changes were quite significant and might have influenced other modules, we invited other PMs and Customer Support Specialists as well.
Our goals were to:
- Inform all the stakeholders that we finalized the research phase
- Share with them the results from the interviews
- Get their opinion about the first wireframes
- Brainstorm some more precise ideas and define priorities
We knew we needed a workshop, a working session to dive deep. Over ten people got very engaged in our initiative, so luckily, we were able to learn from many perspectives. But since we thought the workshop would take several hours, and it was virtually impossible to get all of those people scheduled for that amount of time, we decided to do it asynchronously, coupled with a few check-in meetings along the way.
We first met to give a presentation, discuss a bit and answer some questions. At the end of the meeting, we gave our participants homework to do. It consisted of putting their ideas for the features and options that should be available under each tab on the new analytics page. As we divided each page into Overview (with charts and graphs) and Data (with complete data tables), we asked them to answer two essential questions for each of them:
- What data should be displayed? How to show it on the Overview page?
- What types of actions should be available for users to take?
We also provided a separate space for “General thoughts and additional comments."
After that, we met once again to discuss some urgent ideas and asked clarifying questions. During this meeting, we asked the participants to prioritize all the ideas. I moved everything to a Miro board and used dots in different colors so that they could put them next to:
- Most important improvements (red)
- Ideas to implement in the next phase (yellow)
- Very low-priority ideas (blue)
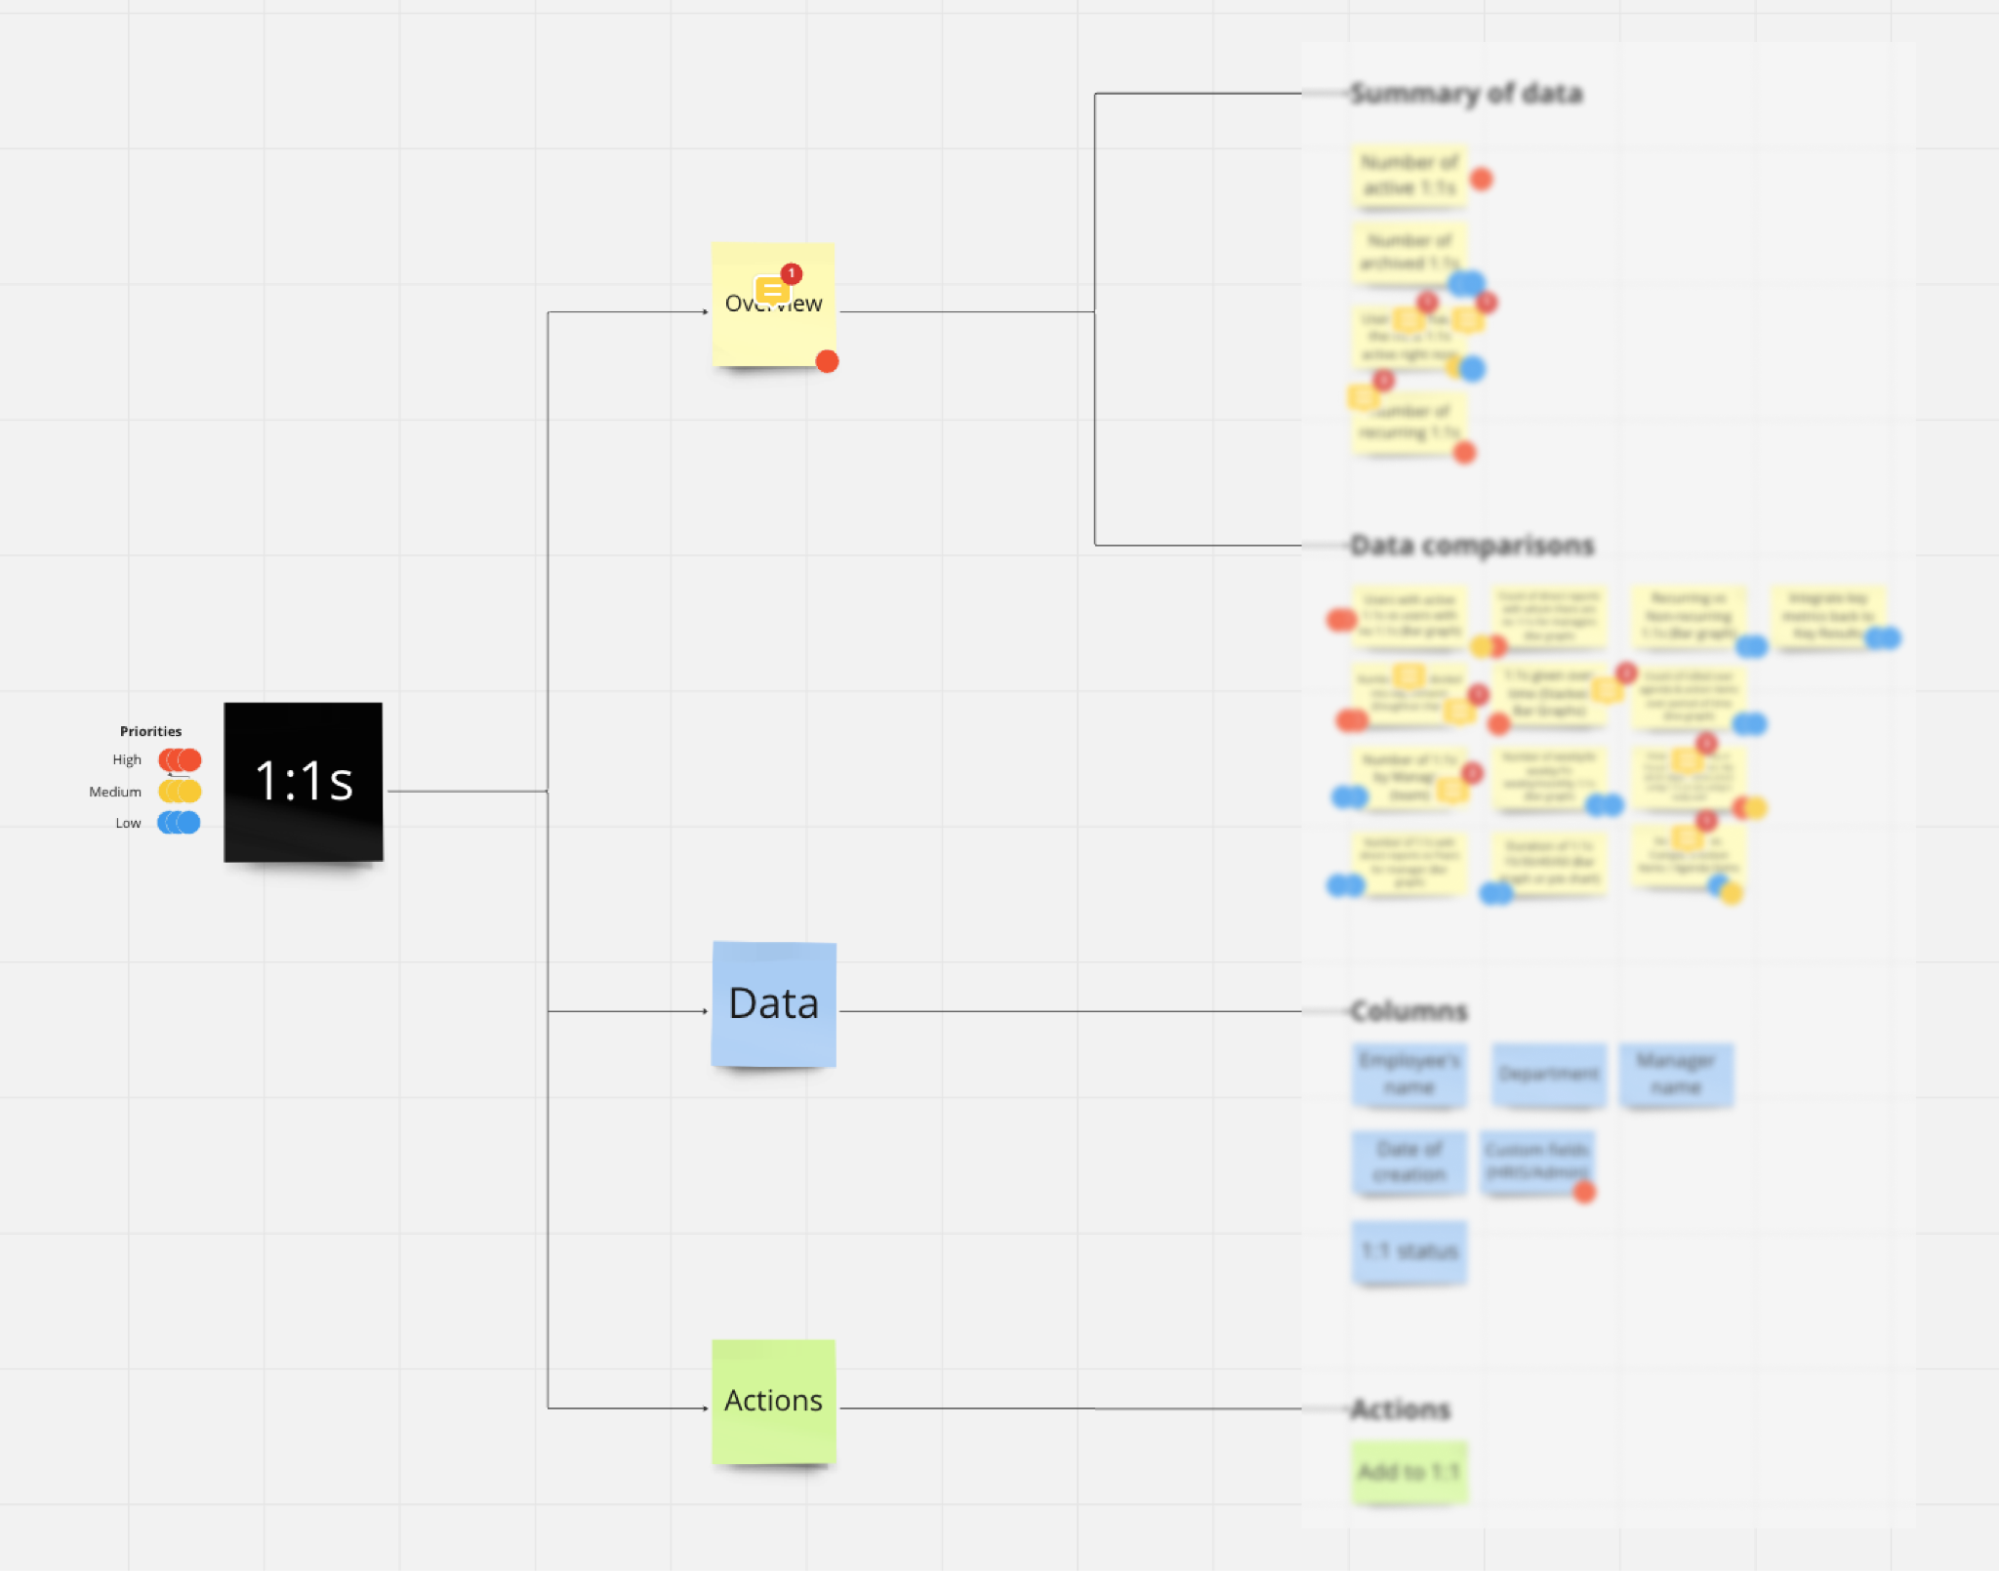 Image 6: Miro board, part of the features and priorities list
By using Miro for this purpose, we could also continue our discussion in comments on the board. This provided us with a deeper understanding of everyone’s point of view. We ended the whole process after about two weeks and were finally ready for the design phase!
Next steps — design phase
Before moving straight to designing the new pages, I needed to work out a plan with the PM. He had to make sure we had alignment on the idea prioritization and check the availability of the developers. We started consulting with the developers about some technical constraints, and the PM worked on the plan and documentation for all the data we needed to include.
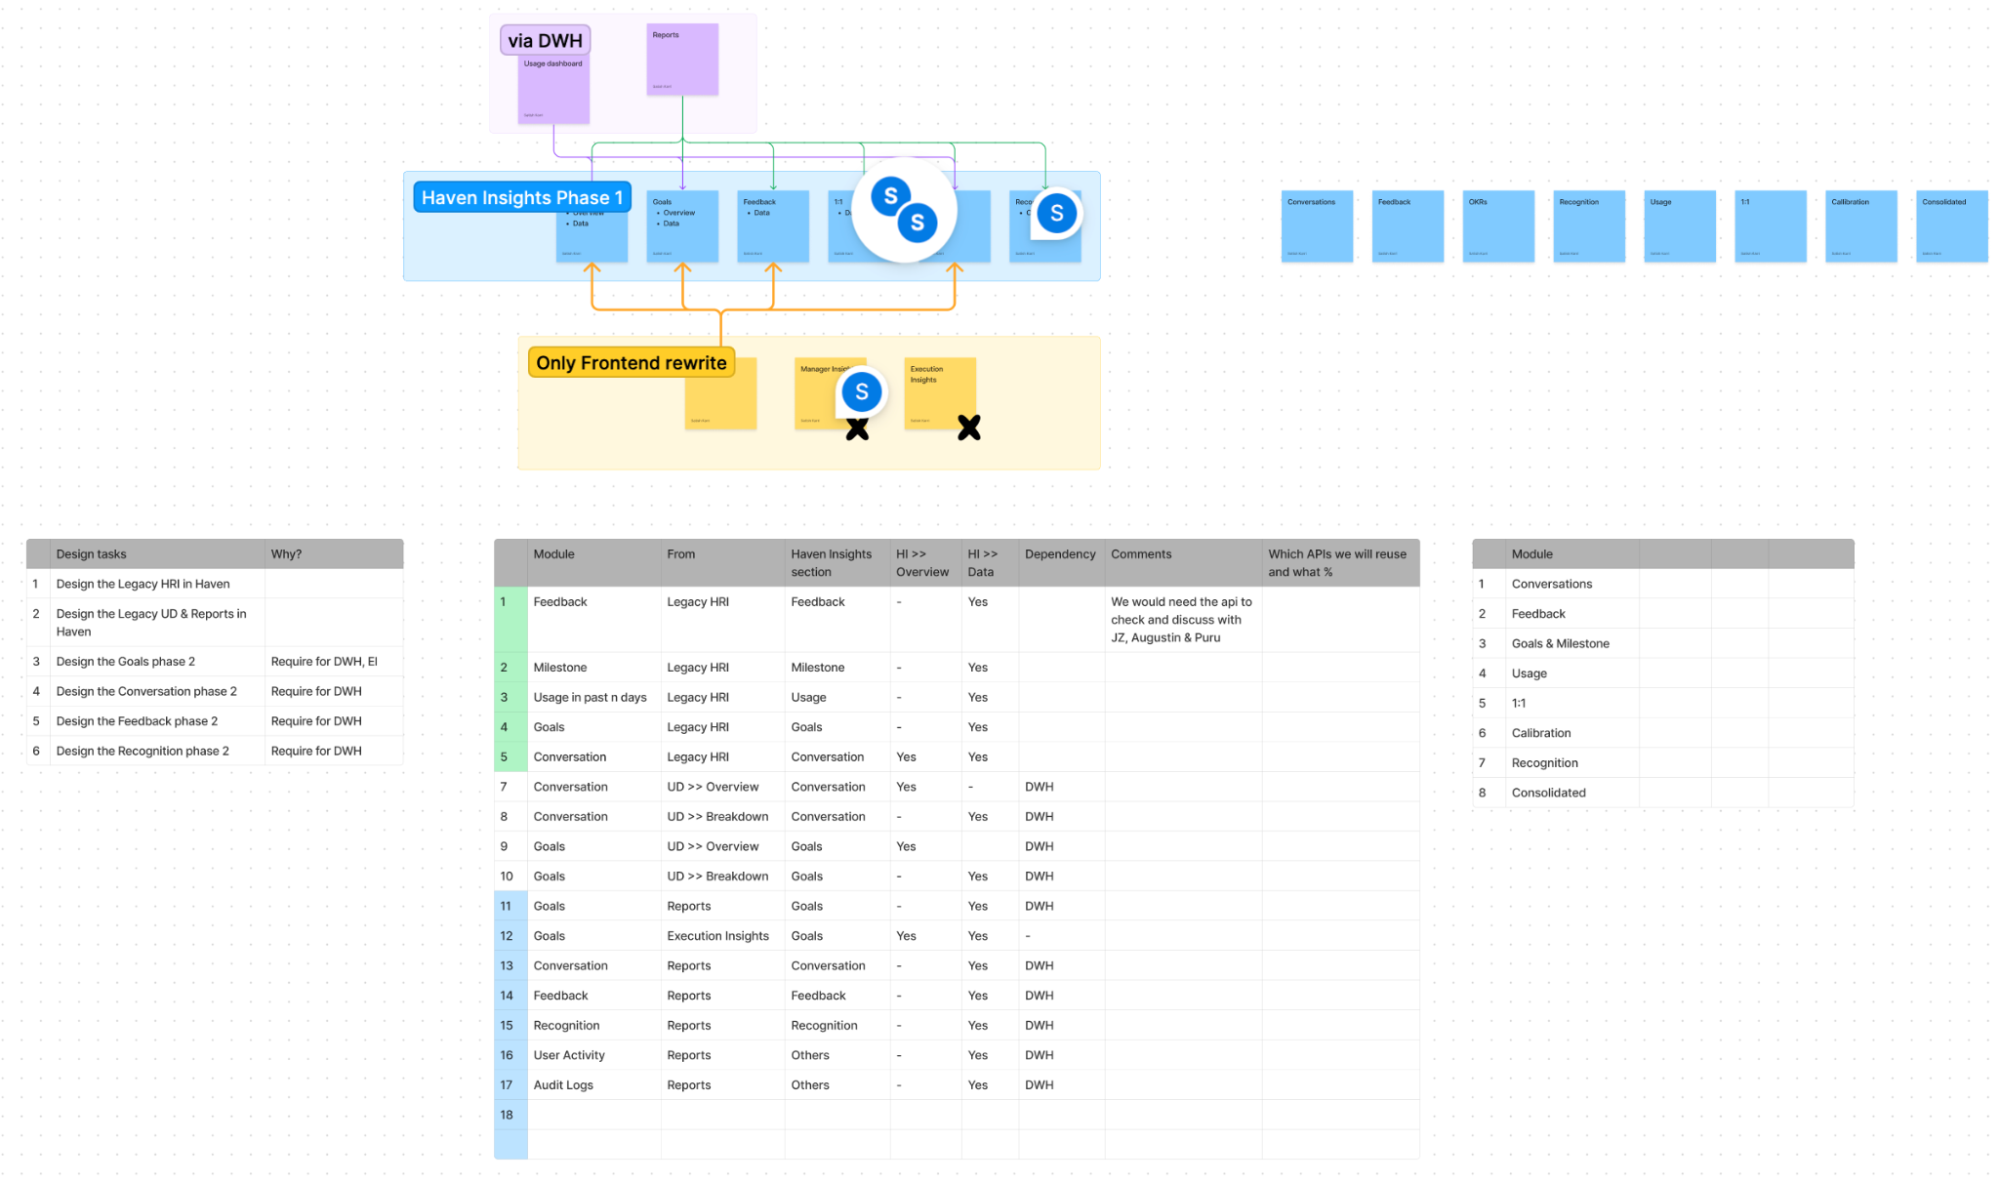 Image 7: FigJam board, part of the plan for designing and developing the new Insights page
Since some of the user experience changes required changes to the back-end architecture, we had to break down the design changes into phases. The earlier phases would require little, if any, back-end changes and the more complex back-end changes would push the corresponding design changes to later phases. The current plan contains four phases but may change over time.
Summary
To sum up this five-month journey, I can say one thing - it was definitely worth the effort! Implementing the enhancements we designed will significantly improve users’ work. It is gratifying to see product decisions made based on research findings that will provide them with material not just for the next release but into the future. The whole team sees the advantage that comes from talking to users and collaborating with them closely. As a follow-on, the client is planning to run user testing sessions once the new version of the application is released. I am really looking forward to seeing their success!
Client's testimonials
The research we conducted on Analytics was invaluable in helping us understand how our users currently use our product, and what they envision for it in the future. We now have a better understanding of how they think about and use the data we provide, and will be able to make much better design decisions going forward. — UX Team Director at Betterworks
UX research played a crucial role, uncovering gaps and validating ideas. It enabled objective task prioritization and instilled confidence in our user appreciation. Malgo, our outstanding UX designer, played a key role in these efforts to shape intuitive experiences. Their dedication and expertise were highly valued. Together, we prioritized tasks effectively and created products that users truly appreciated. — Senior Product Manager of Analytics

You may also like

The Product Health Check: How to Find Performance Bottlenecks Before They Cost You Users
5 July 2026 • EL Passion

Staff Augmentation vs. Managed Teams: Which Model Saves You More on Long-Term Overhead
5 July 2026 • EL Passion
The Cost of Waiting: How Refactoring Your Legacy App Prevents Massive Technical Debt in 2026
31 May 2026 • EL Passion
We’re available for new projects.
